With a strategy (strategy()) on the chart, the Strategy Tester tab shows the backtest:
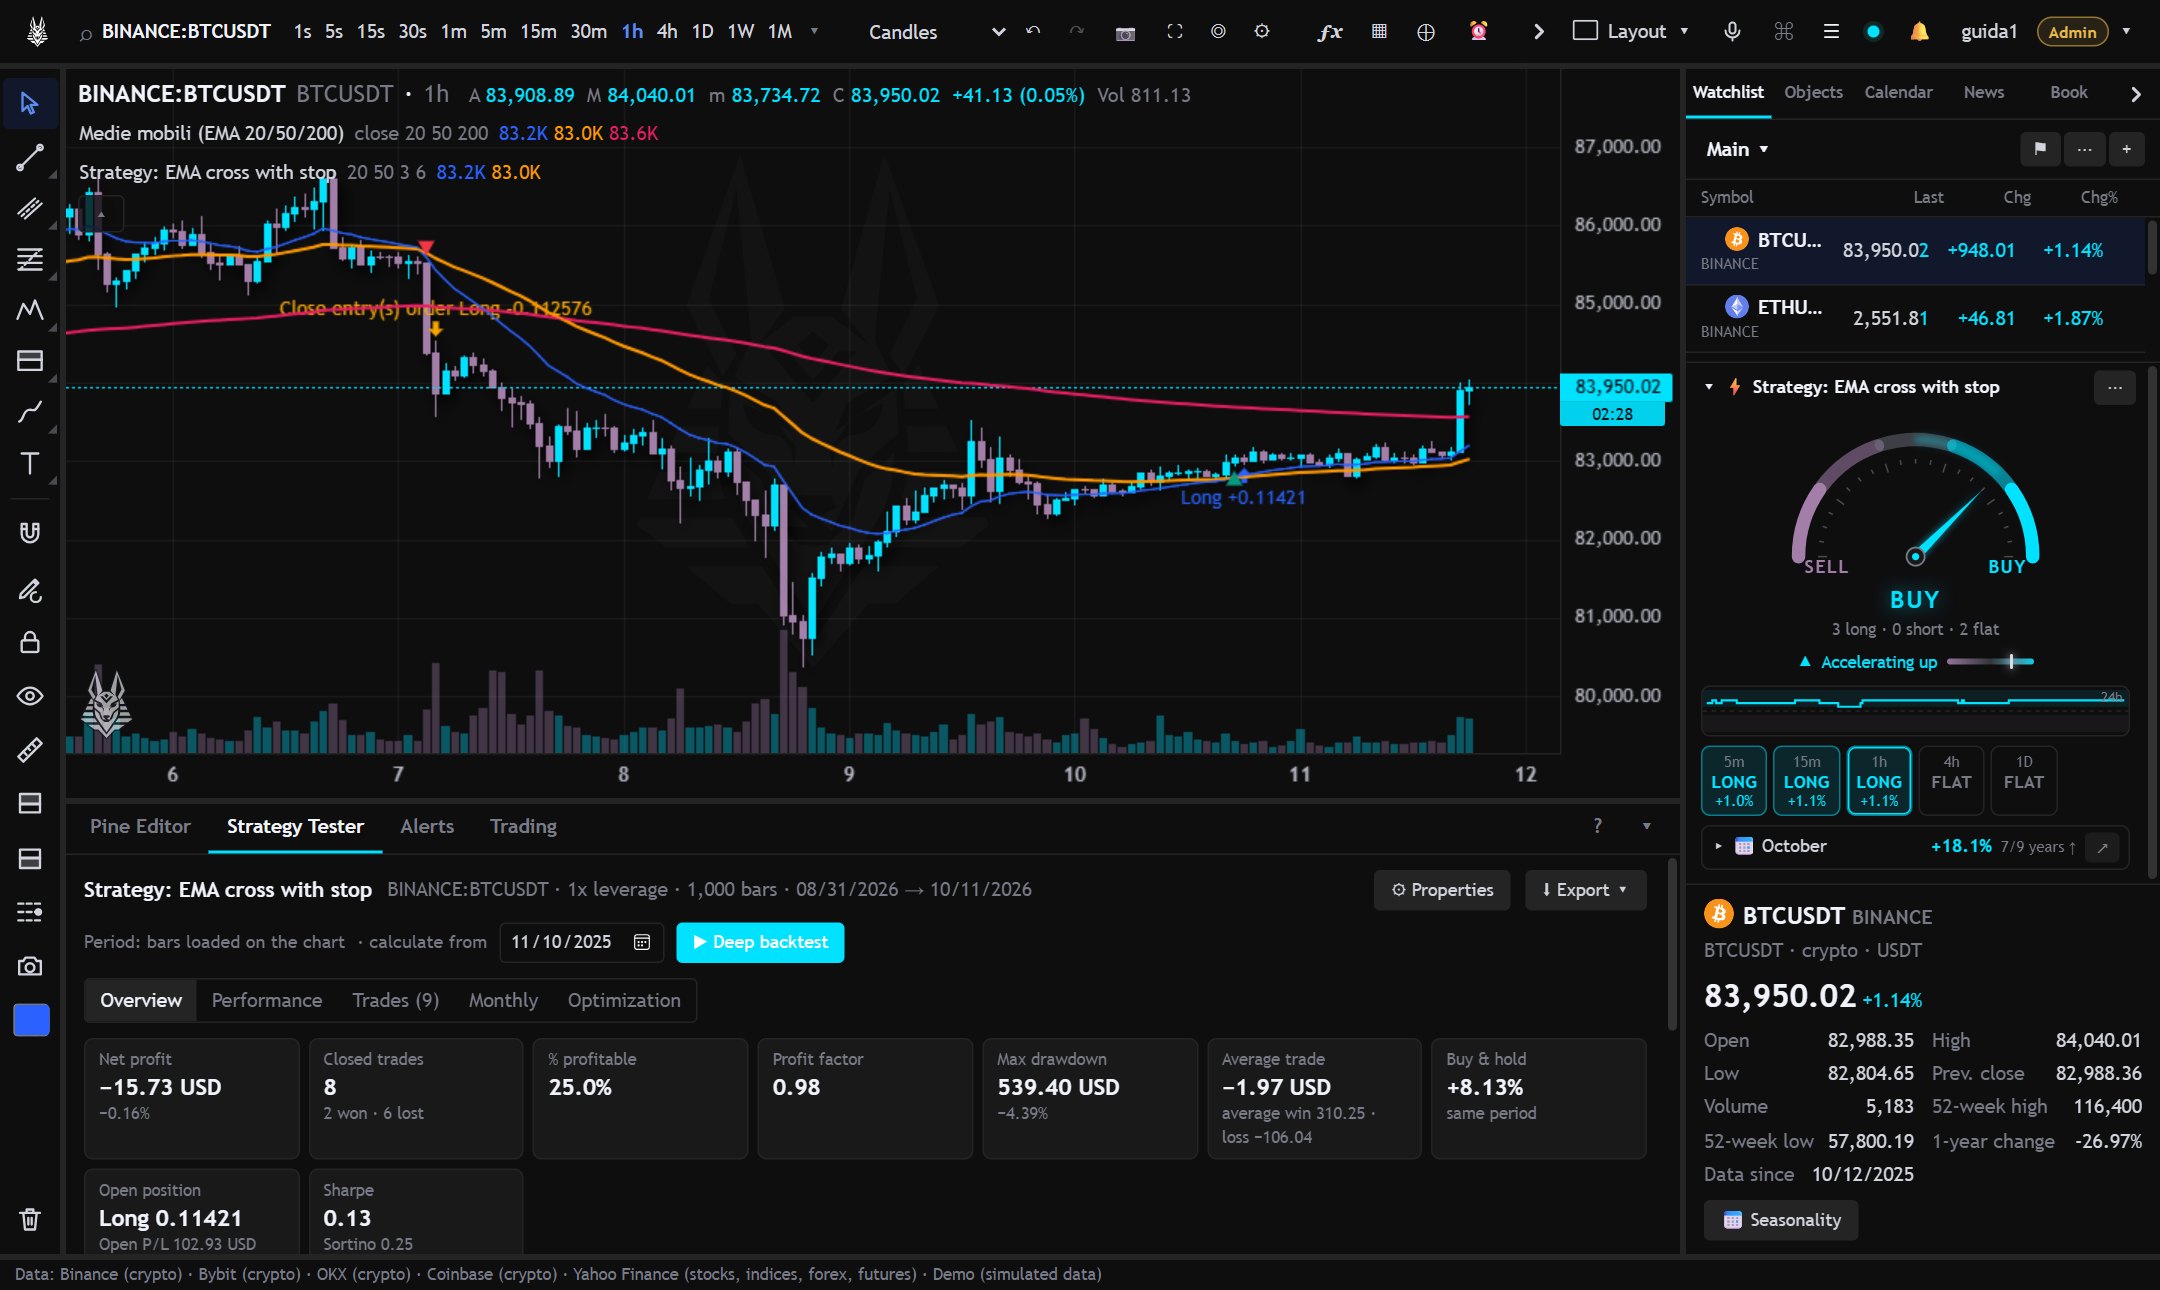
- Overview: net profit, maximum drawdown (the largest loss from a peak in dollars, with its percentage of that peak) and relative drawdown (the largest loss in percentage, which may fall in another period, for example when the capital was smaller), percentage of winning trades, profit factor, equity and drawdown curves.
- Performance: the full statistics, split into long and short.
- Trades: each trade with entry, exit, profit, maximum gain and maximum loss during the trade. A click takes the chart to that trade.
- Monthly returns: table by year and month.
Deep backtest
By default the backtest uses the bars loaded on the chart. ▶ Deep backtest computes it over a longer period, starting from a date of your choice.
Optimization
Choose the inputs to vary (from, to, step) and the metric to improve (profit, drawdown, profit factor, Sharpe…): the optimizer tries the combinations and ranks them. “Apply” brings the best values into the script.
The report can be exported to Excel, PDF (to print or save) or CSV.