They measure the push of the price and the excesses: they sit in a pane under the chart.
RSI with zones
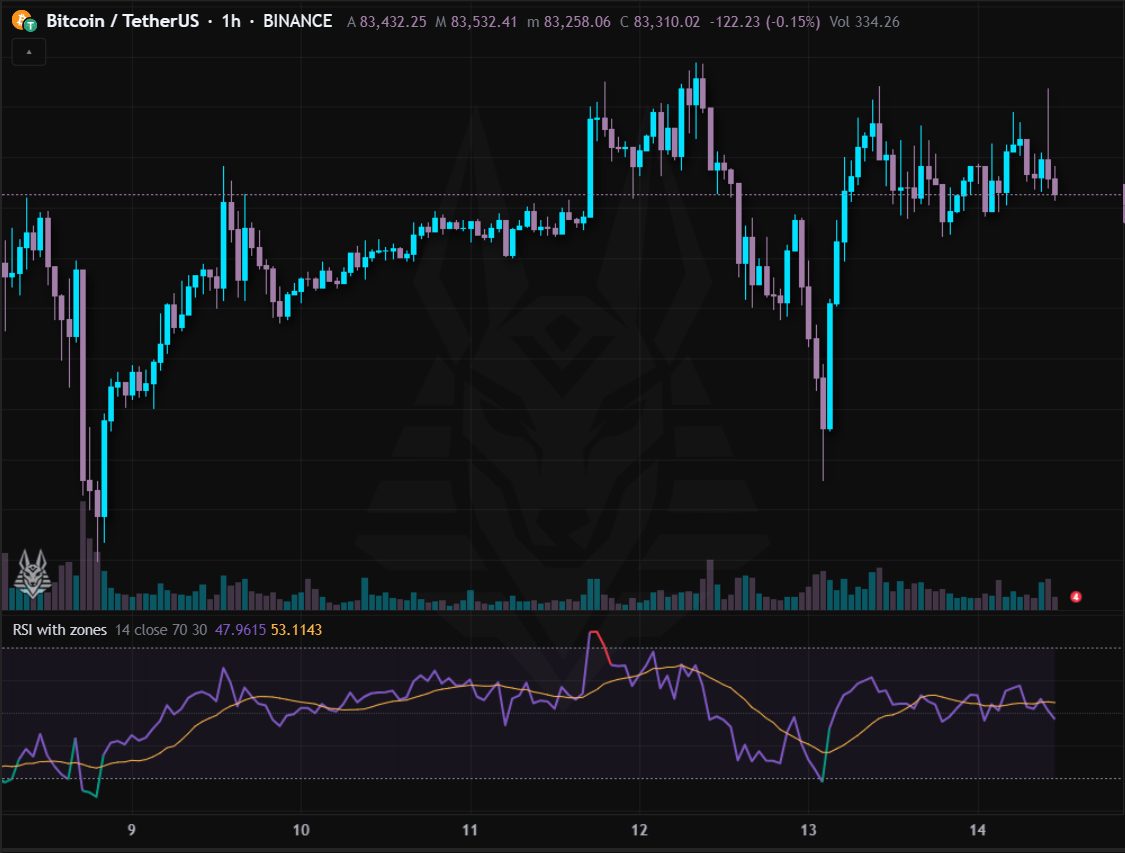
Relative strength index: it oscillates between 0 and 100 and measures the speed of gains against losses. It has an average of its own value and the overbought and oversold zones.
- Above 70 (red): overbought; below 30 (green): oversold. It is not a reversal signal by itself, but a warning of an excess.
- In strong trends it stays in the extreme zone for a long time: divergences matter more (price makes a new high but the RSI does not).
- The 50 line separates bullish from bearish momentum.
Settings: Period (14), source, overbought (70) and oversold (30) levels. Alerts: RSI overbought and RSI oversold.
Multi-timeframe RSI
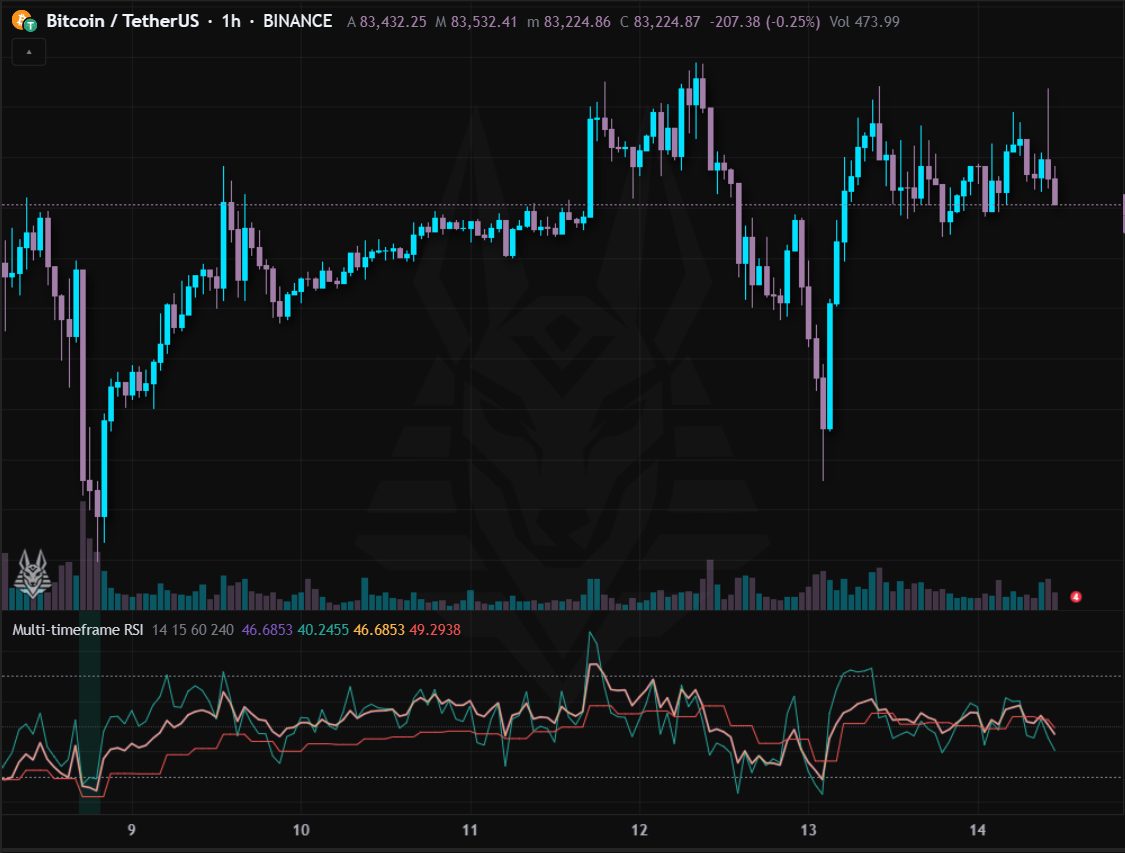
The chart's RSI together with that of three other timeframes (15 minutes, 1 hour and 4 hours by default), overlaid in the same pane.
- All lines in the extreme zone: the excess is shared and the background gets coloured (red above 70, green below 30).
- A higher timeframe rising while the lower one falls points to a pullback inside a bigger trend.
Settings: RSI period (14) and the three timeframes. Alerts: All overbought and All oversold.
Stochastic
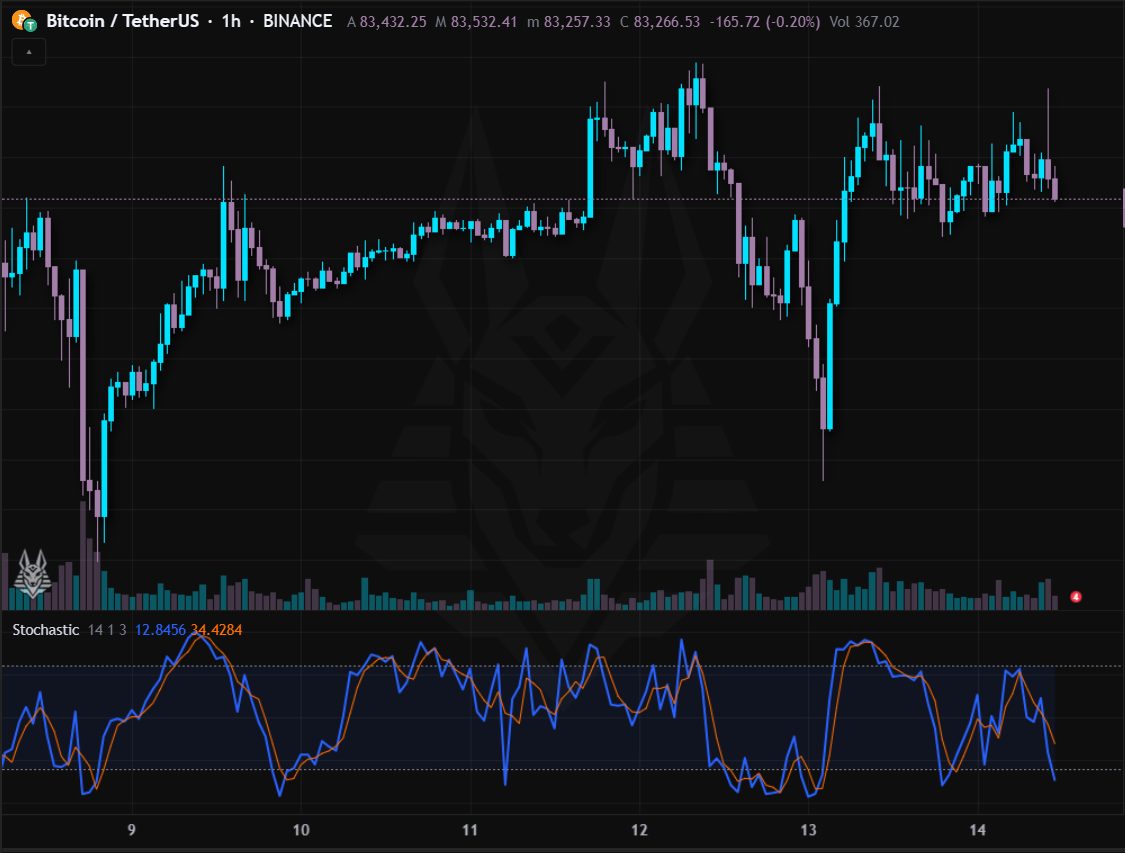
Stochastic oscillator: where the close sits within the range of the last N periods. Two lines, %K (fast) and %D (its average).
- Above 80: overbought; below 20: oversold.
- %K crossing %D in the extreme zone is the classic signal (alerts ready).
- Better in sideways markets; in strong trends it stays at the extremes for a long time.
Settings: %K period (14), smoothing (1) and %D period (3). Alerts: Bullish cross in oversold and Bearish cross in overbought.
Stochastic RSI
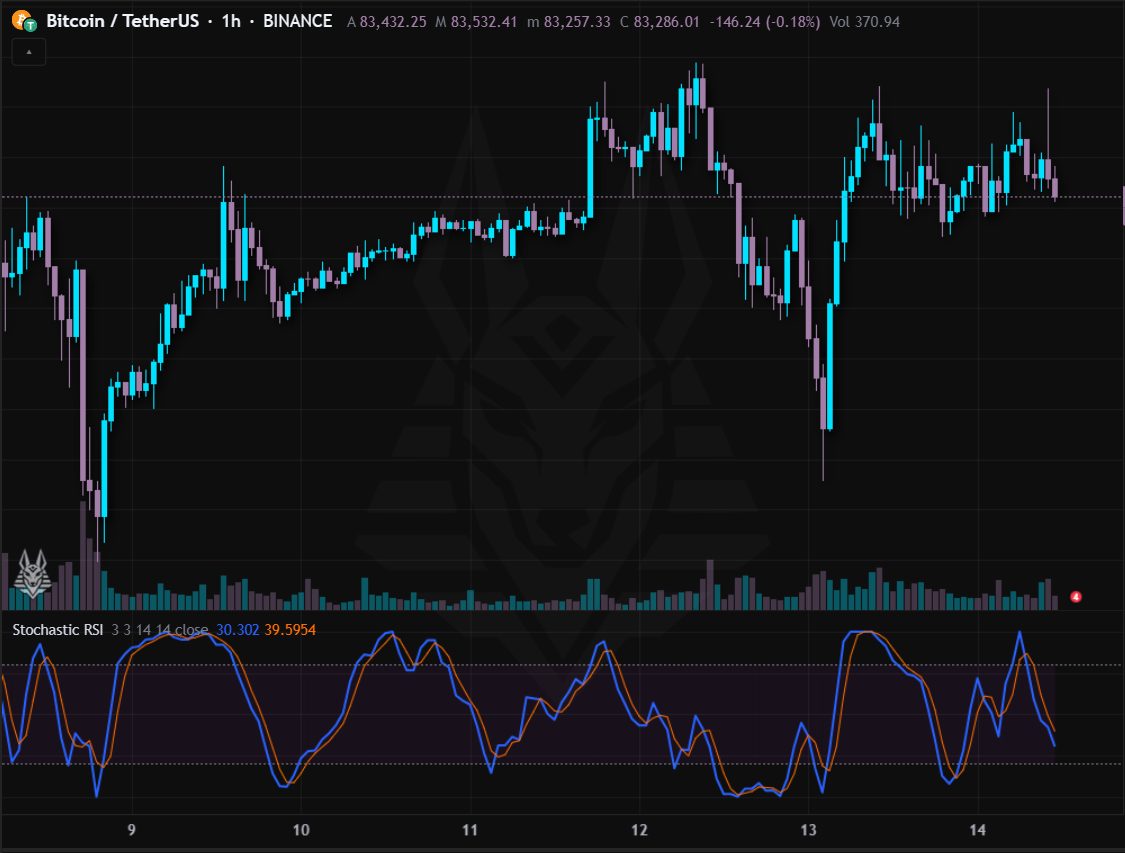
Stochastic calculated on the RSI instead of the price: more sensitive and faster than the RSI, it oscillates between 0 and 100.
- Above 80 / below 20: extreme zones, reached often: context is needed.
- Crosses between K and D anticipate the changes of RSI momentum.
Settings: K (3), D (3), RSI period (14), stochastic period (14) and source.
MACD
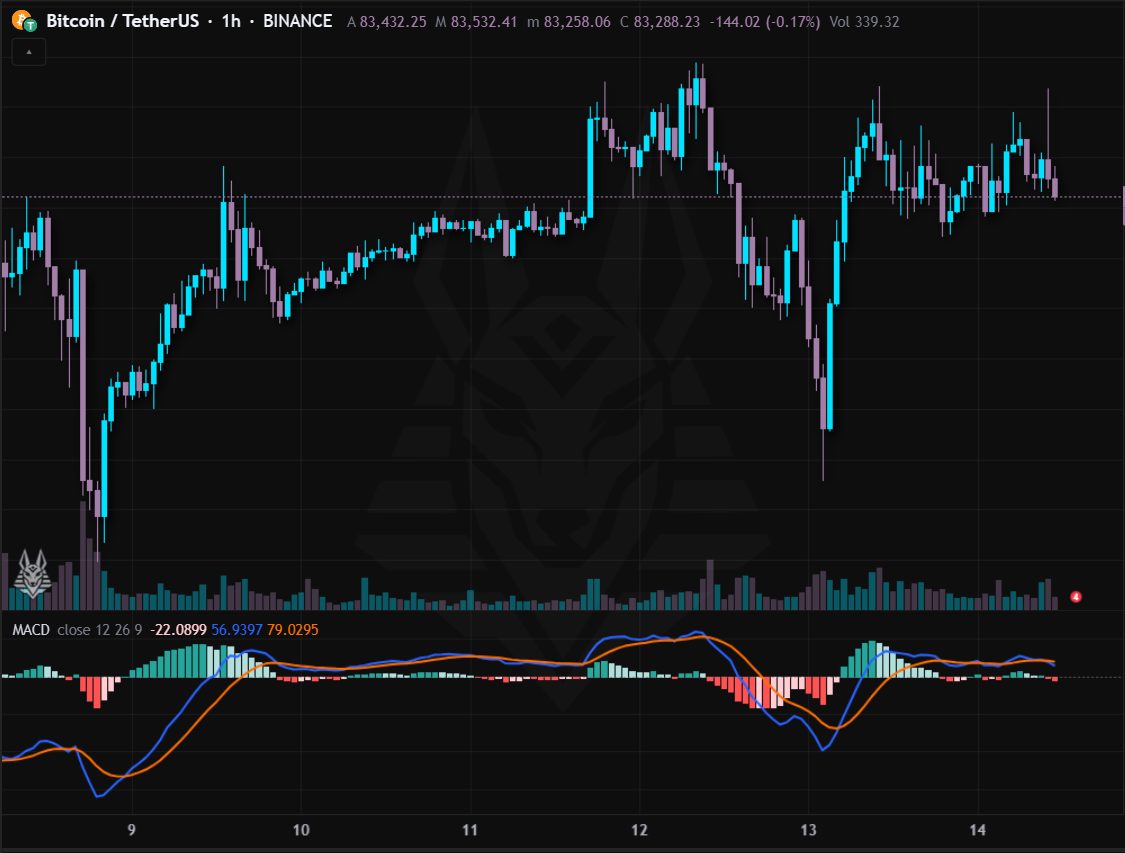
Moving average convergence/divergence: the MACD line (difference between EMA 12 and 26), the signal line (EMA 9 of the MACD) and the histogram, the difference between the two.
- MACD crossing above the signal: bullish push; below: bearish (alerts ready).
- MACD above zero: the short trend is above the long one.
- A shrinking histogram warns that the momentum is running out.
Settings: Source, fast (12), slow (26) and signal (9). Alerts: MACD bullish and MACD bearish.
CCI (Commodity Channel Index)
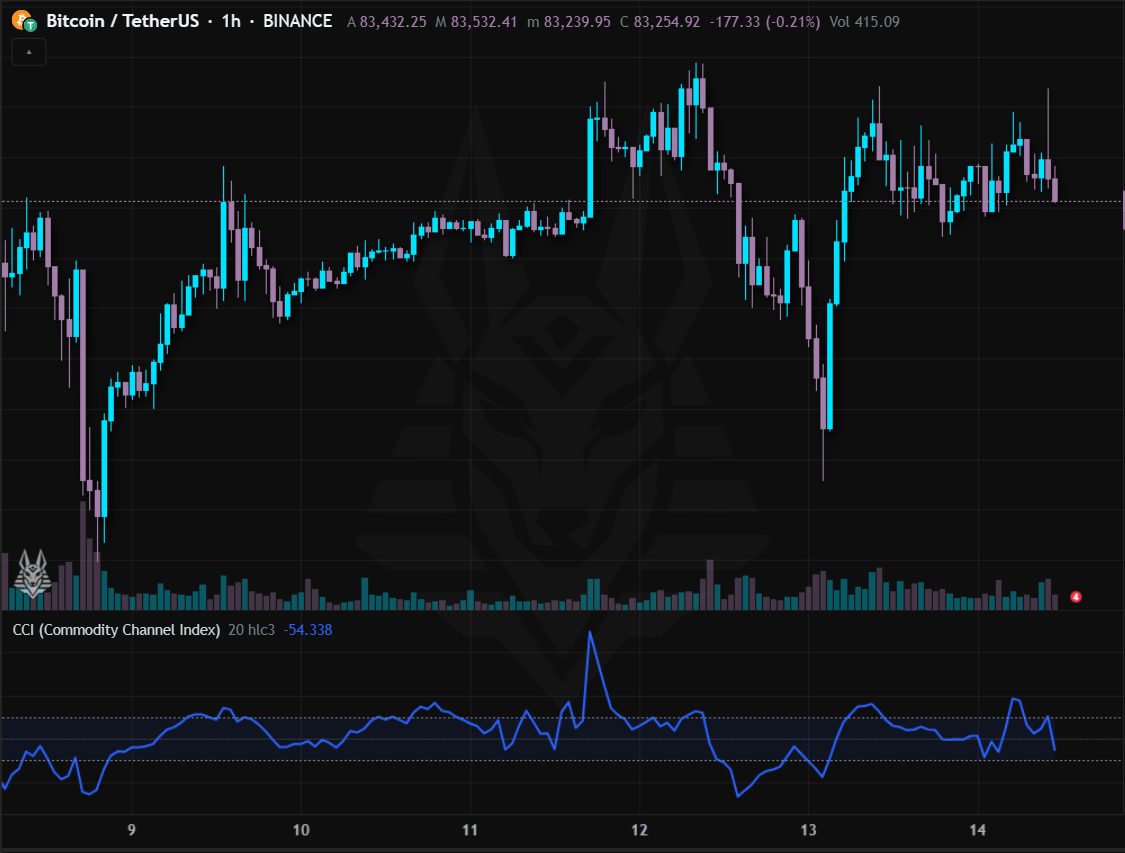
Commodity Channel Index: how far the price (average of high, low and close) is from its mean, in units of deviation.
- Beyond +100: strong bullish push or overbought; below −100: bearish or oversold.
- A return under +100 or above −100 often marks the end of the excess.
Settings: Period (20) and source.
Williams %R
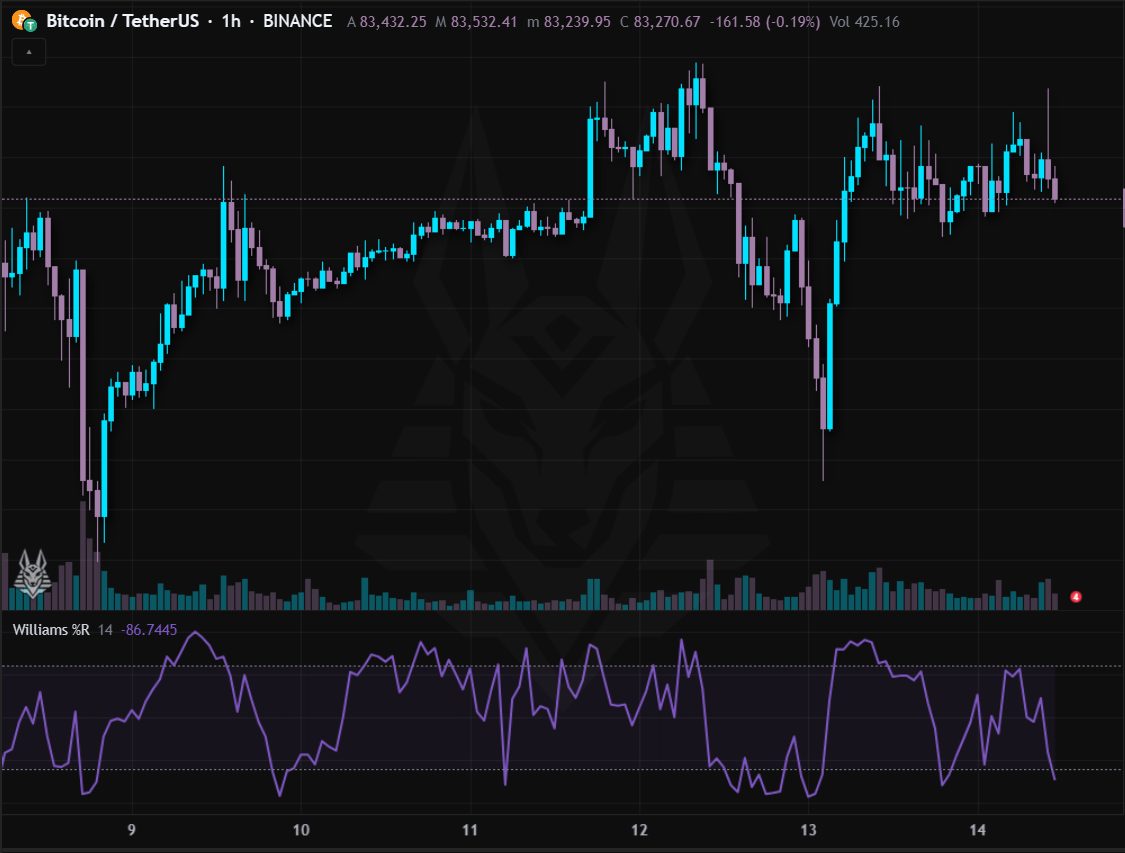
Williams %R: similar to the stochastic but on a −100 to 0 scale, it shows where the price closes relative to the high of the last N periods.
- Above −20: overbought; below −80: oversold.
- It is fast: use it together with a trend filter.
Settings: Period (14).
ROC and Momentum
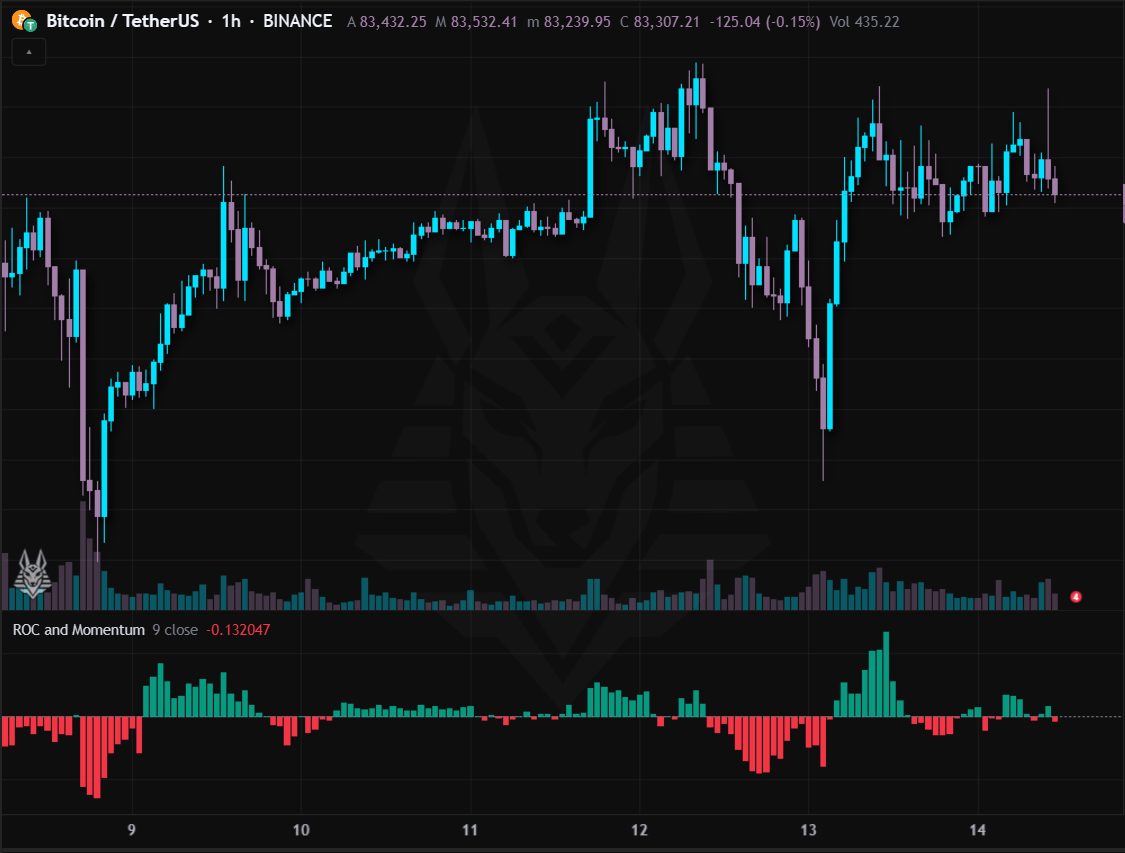
Rate of Change: the percentage change of the price compared with N bars ago.
- Above zero: the price is higher than N bars ago (bullish push); below: bearish.
- Extreme peaks signal excessive moves; divergences with the price warn that the momentum is fading.
Settings: Period (9) and source.
MFI (Money Flow Index)
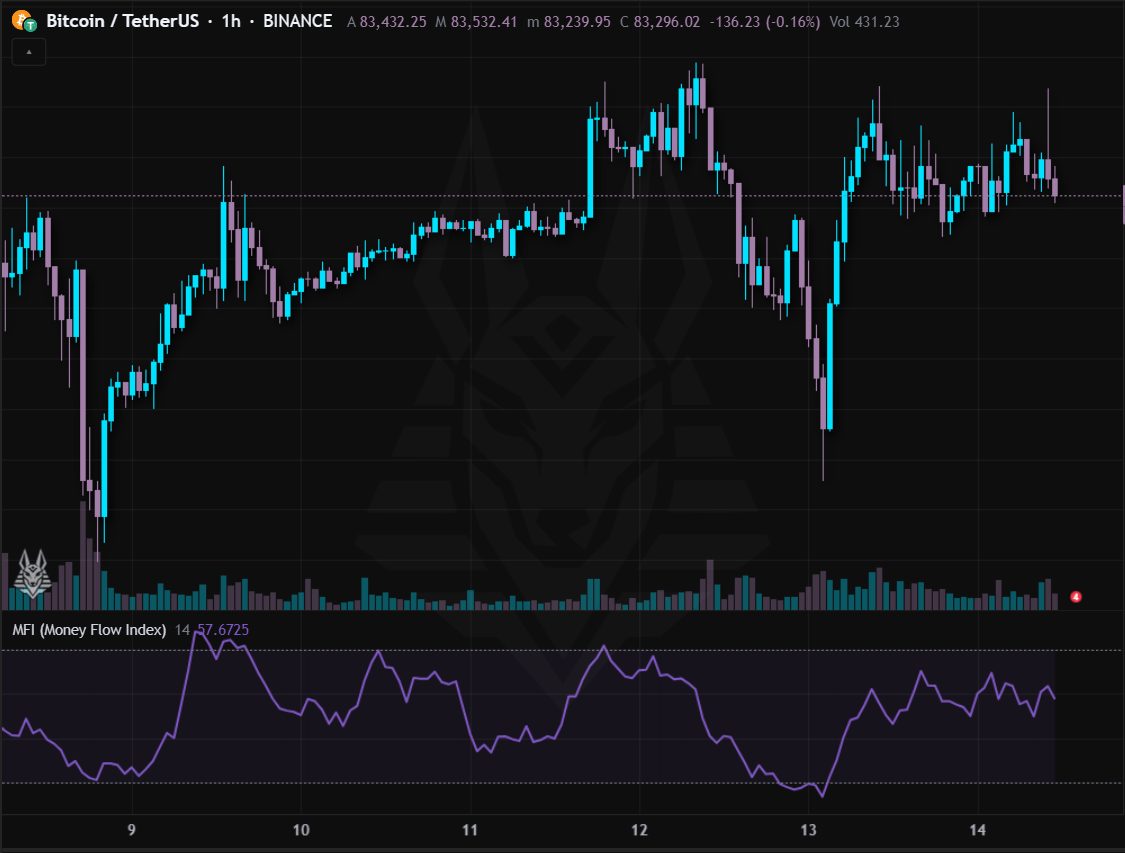
Money Flow Index: like the RSI but weighted by volume, so it tells whether money is flowing in or out.
- Above 80: overbought; below 20: oversold.
- A divergence with the price, with the same volumes, is a sign of weakness.
Settings: Period (14).
Squeeze Momentum
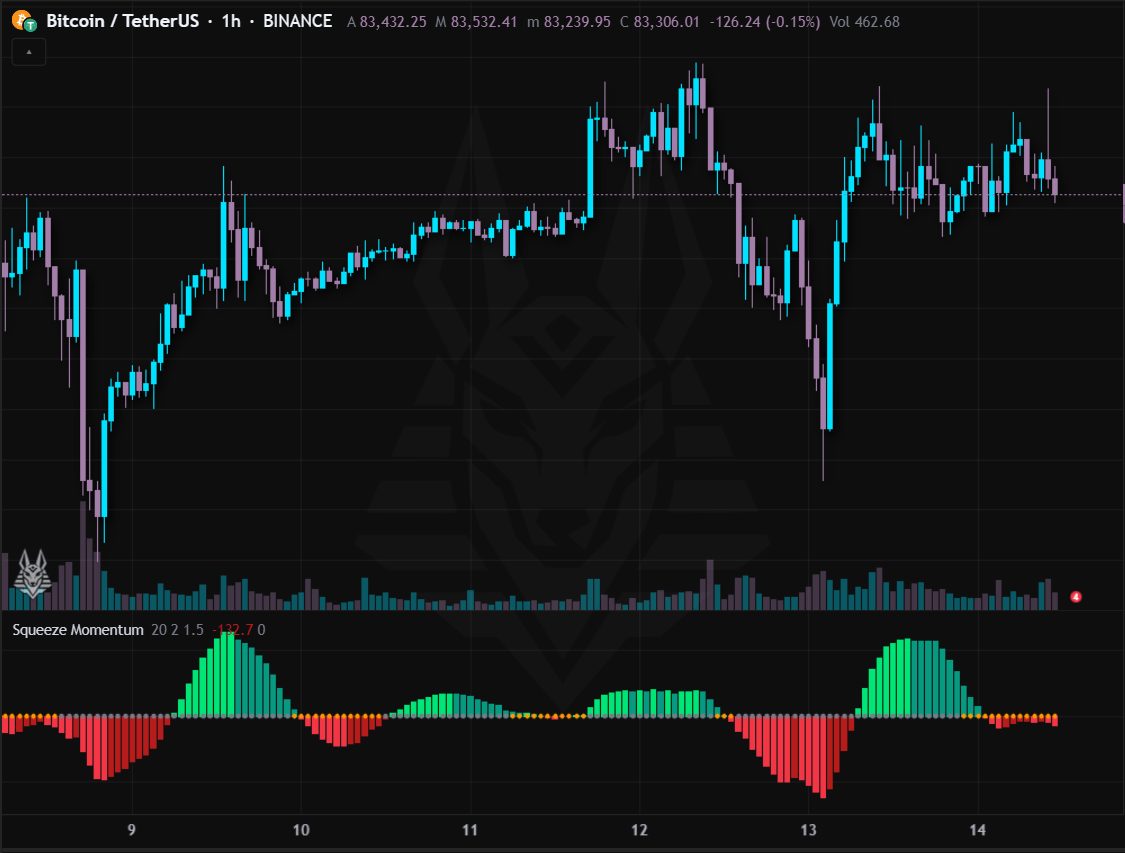
Squeeze Momentum: it signals when the Bollinger bands tighten inside the Keltner channels (compressed market) and shows the momentum with a histogram.
- Orange cross on the zero line: compression under way; grey cross: the compression is over.
- After a compression a strong move often starts: the histogram suggests the direction (green above zero, red below).
- Lighter colours = the momentum is growing, darker = it is fading.
Settings: Period (20) and the Bollinger (2) and Keltner (1.5) multipliers. Alerts: Squeeze on and Squeeze released.