Volume, volume-weighted price and perpetual futures data. Open interest, long/short and liquidations only work on symbols with “.P” (Binance, Bybit, OKX).
Volume with average
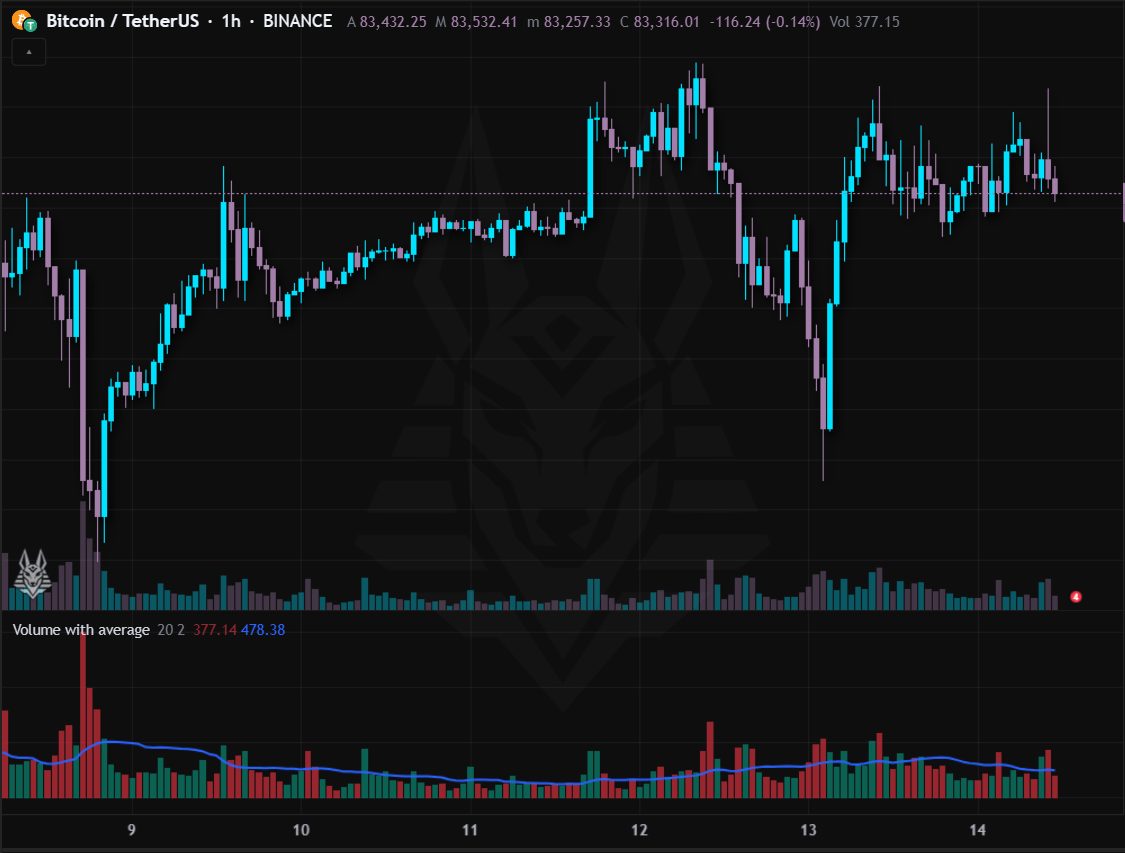
Volume histogram with its average: bars well above the average are highlighted as abnormal volume.
- A move with high volume is more credible than one with low volume.
- Abnormal volume on a high or low bar can signal an exhaustion or a real breakout.
Settings: Average (20) and abnormal volume threshold (2 × the average). Alerts: Abnormal volume.
OBV (On Balance Volume)
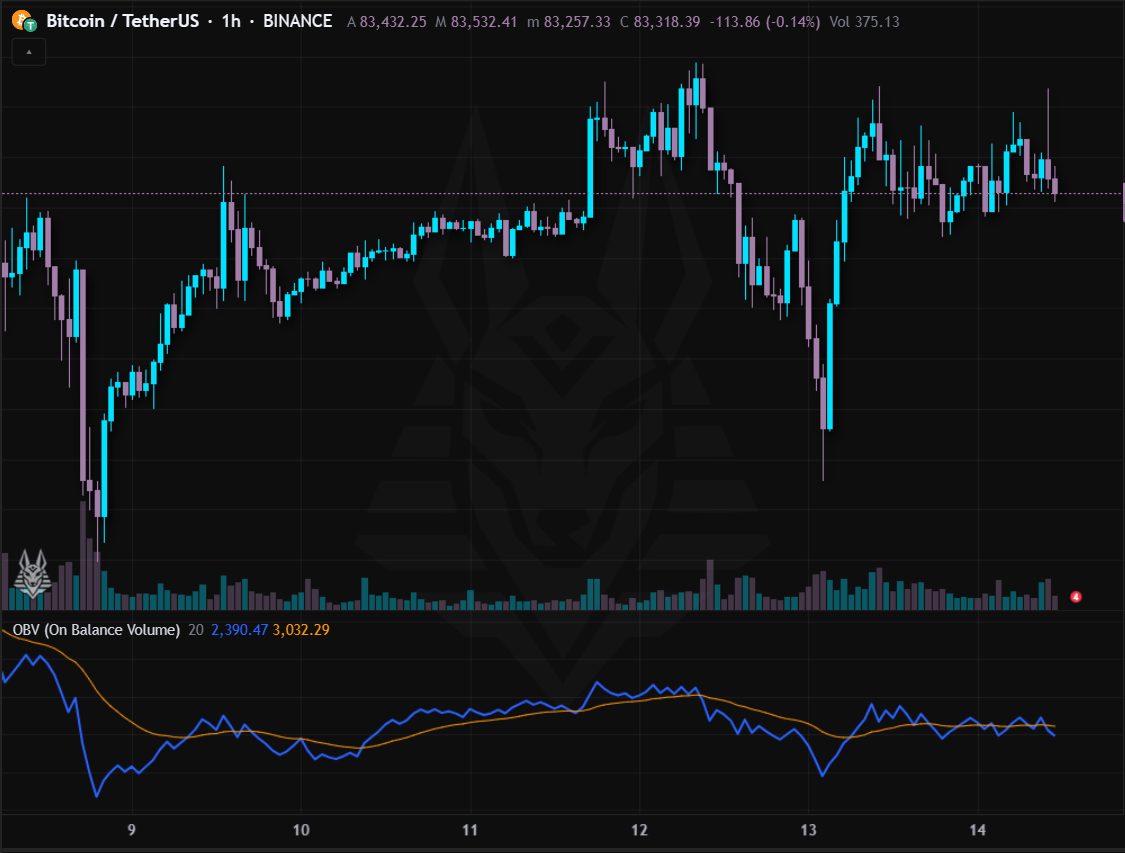
On Balance Volume: adds the volume of up bars and subtracts that of down bars, with an average.
- OBV rising with the price confirms the trend; a divergence (price rises, OBV does not) warns that volume does not support the move.
- A break of an OBV high can precede that of the price.
Settings: Average (20).
CVD (cumulative delta)
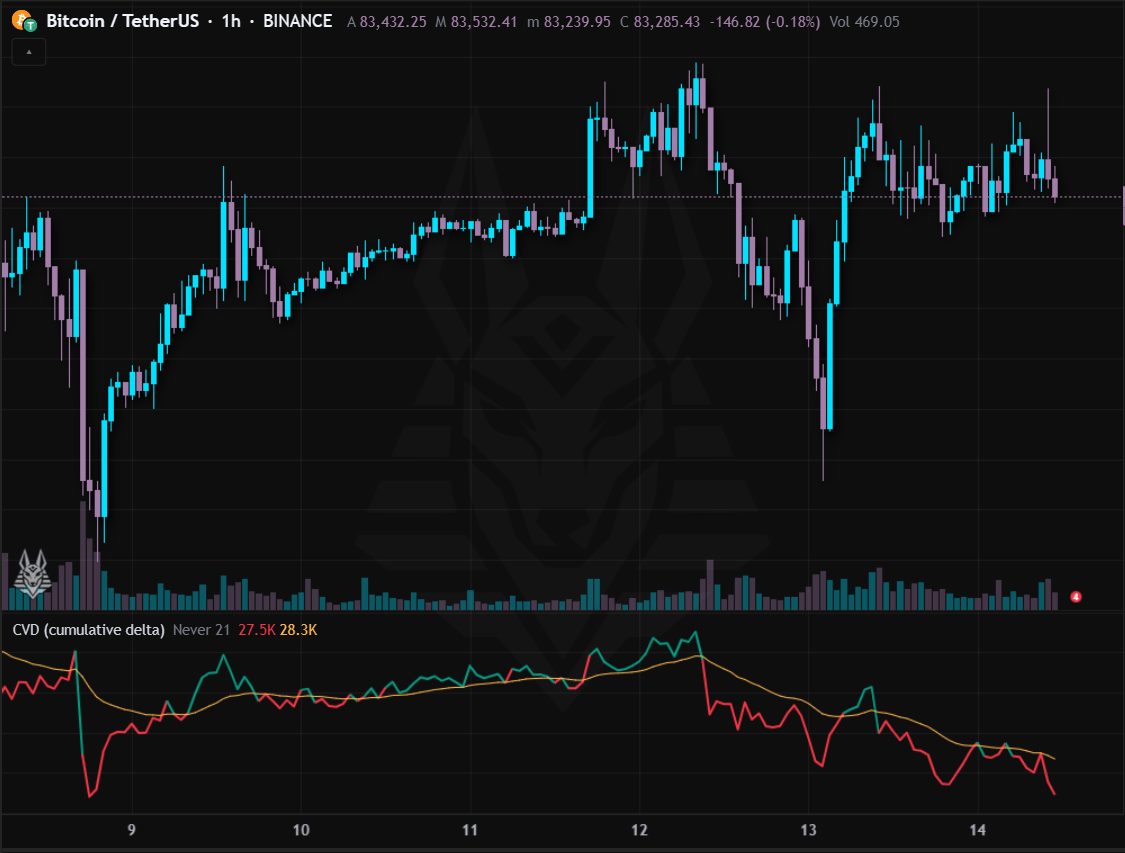
Cumulative volume delta (CVD): for every bar it estimates the difference between buying and selling volume from the position of the close in the range, and adds it up over time. It is an estimate: it does not use real trade data.
- CVD rising with the price: the rise is backed by buying; falling while the price rises: buyers are weak (divergence).
- The line above its average shows buying pressure.
Settings: Reset (never or every day) and average (21). Alerts: CVD above the average and CVD below the average.
Session VWAP with bands
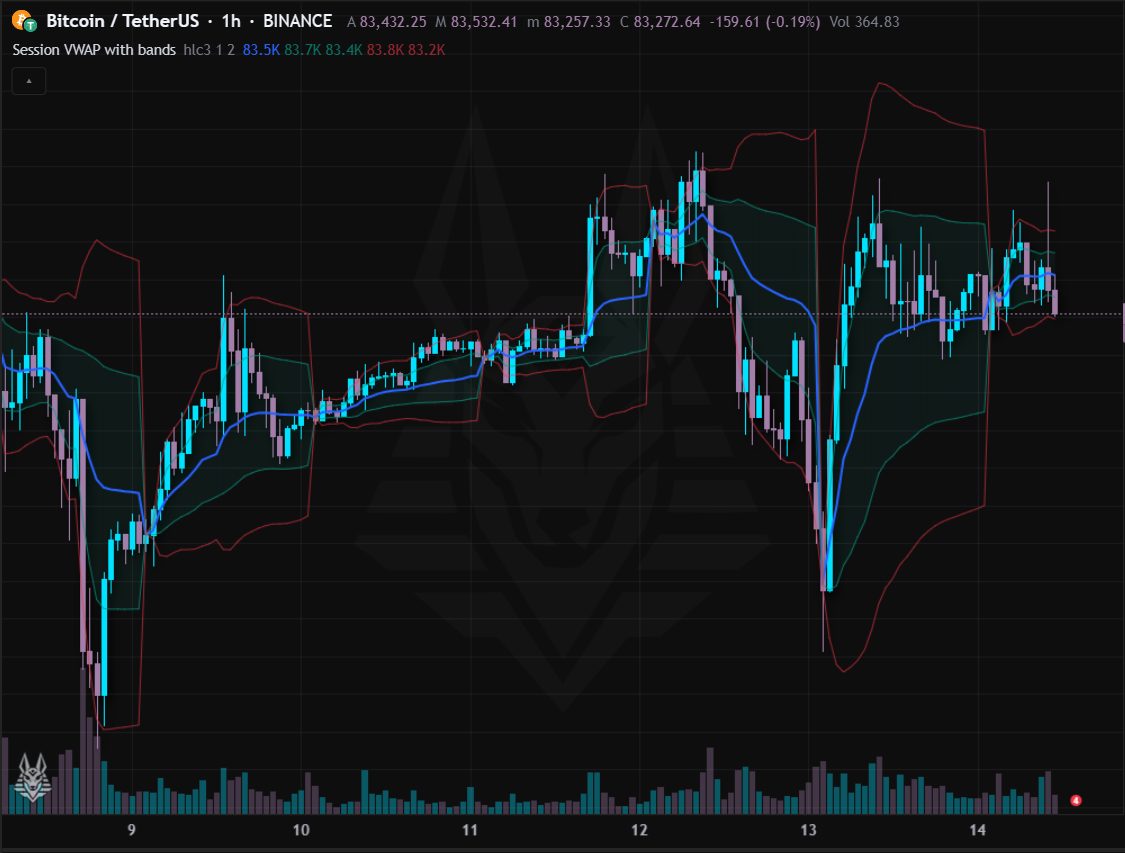
Volume-weighted average price of the session (it restarts every UTC day), with bands at 1 and 2 deviations.
- It is the “fair price” of the day for institutional traders: above the VWAP the buyers are in control, below it the sellers.
- The bands show the excesses relative to the VWAP: extensions at 2 deviations are often followed by a return.
Settings: Source (hlc3) and width of the two bands (1 and 2). Alerts: Price above VWAP and Price below VWAP.
Anchored VWAP
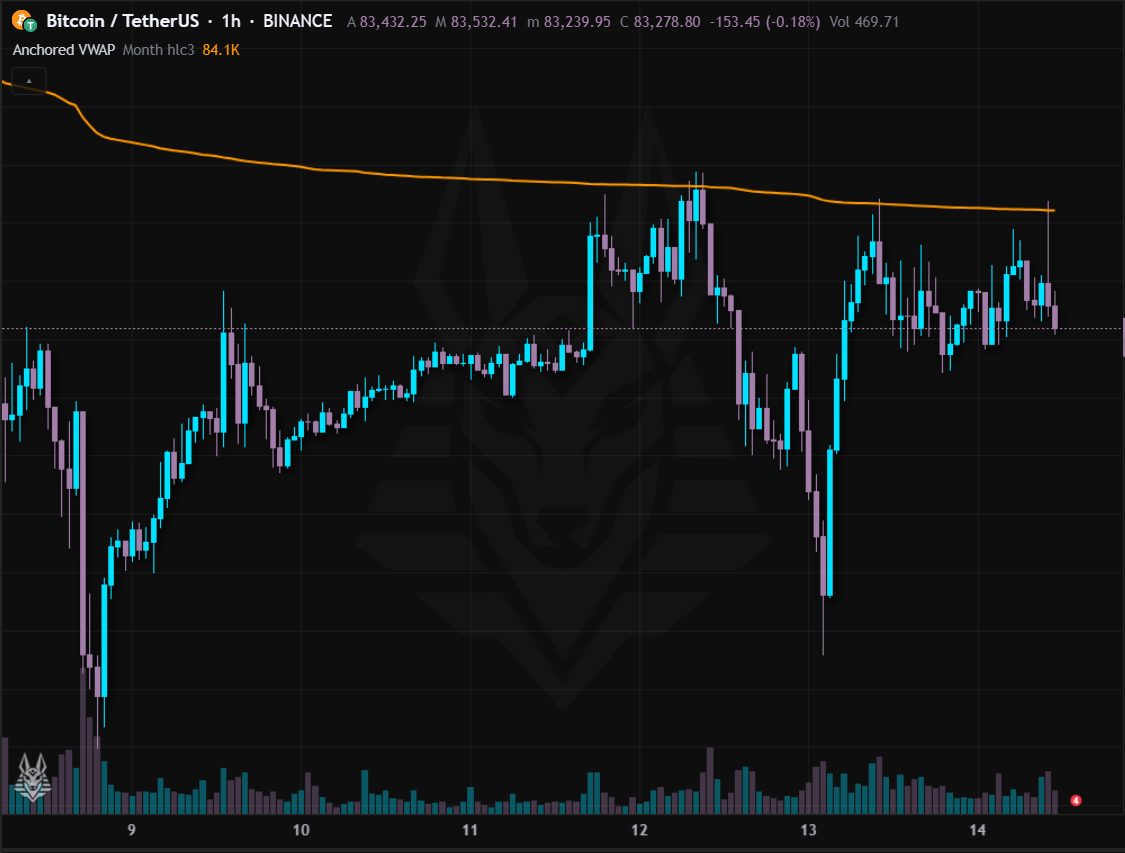
A VWAP that restarts from a point of your choice: start of week, month, year or a precise date (for example the day of an important low). The colour shows whether the price is above (blue) or below (orange).
- It shows the average price paid by those who entered from that point: the price coming back to the line is a frequent test.
- Anchored to a swing low or high it becomes dynamic support or resistance.
Settings: Anchor (week, month, year, chosen date), chosen date and source. Alerts: Price above VWAP and Price below VWAP.
Open Interest (perpetuals)
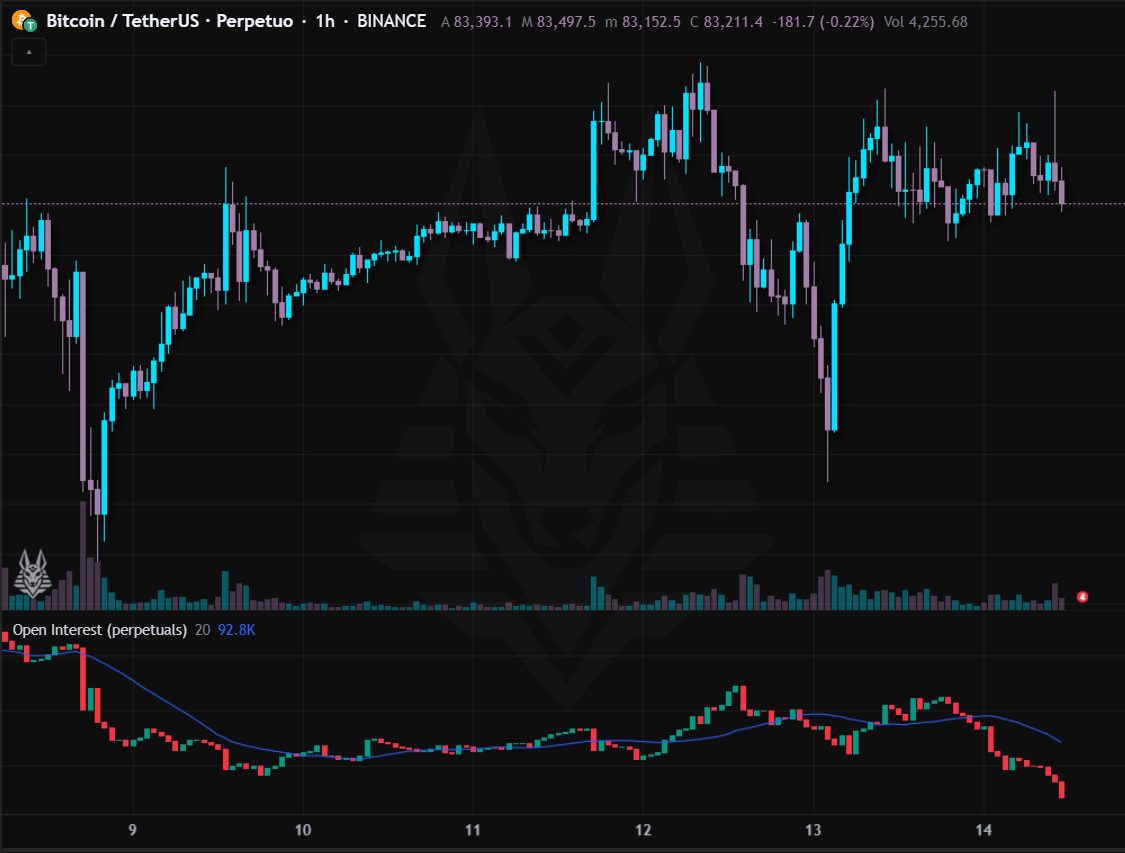
Open interest of perpetual futures: the open contracts in base currency, with an average. Only for symbols with “.P” on Binance, Bybit and OKX, from 5 minutes up.
- Price and OI rising: new positions in the direction of the trend; price rising with OI falling: shorts closing, a less solid rise.
- A very high OI is fuel for violent moves (chains of liquidations).
Settings: Average (20).
Long/short ratio (perpetuals)
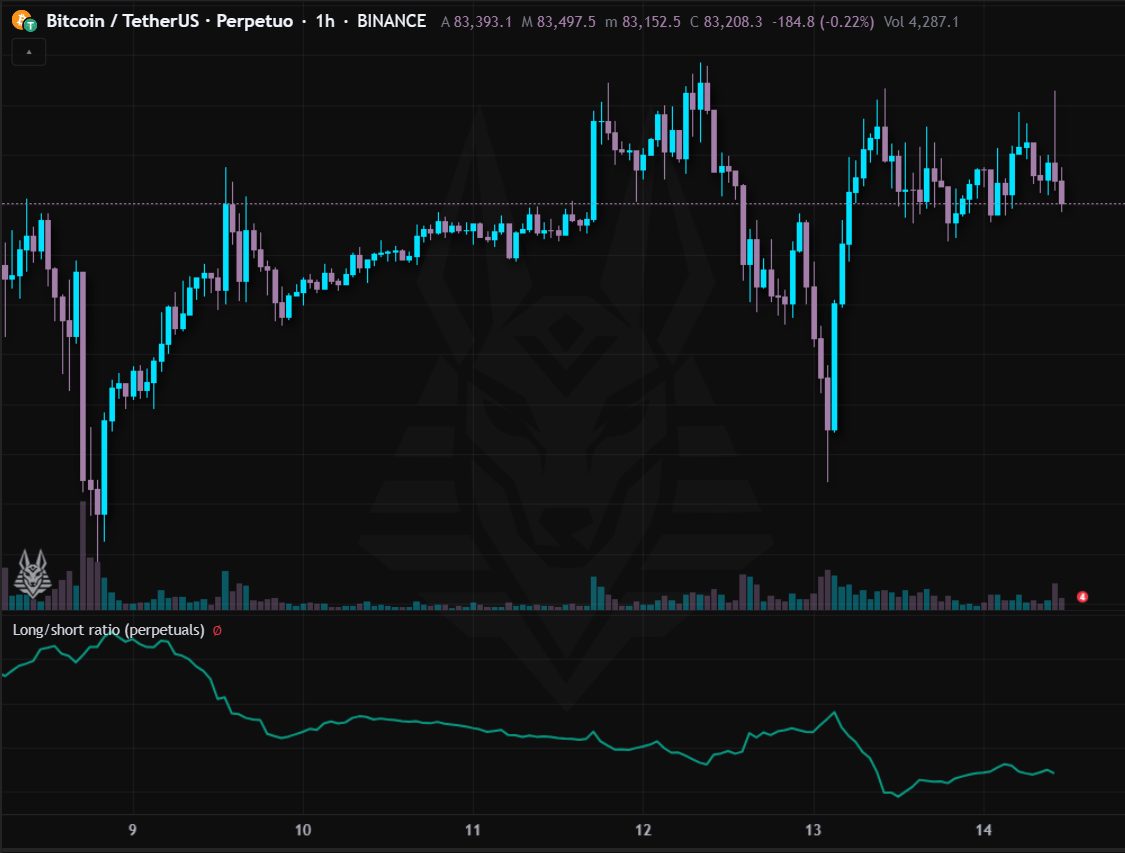
Ratio between long and short accounts on the perpetual (from 5 minutes up; Binance keeps only 30 days). Above 1 the longs prevail.
- Extreme values show a crowd on one side only: often a contrarian signal.
- Read it together with price, open interest and funding.
Settings: None.
Liquidations (perpetuals)
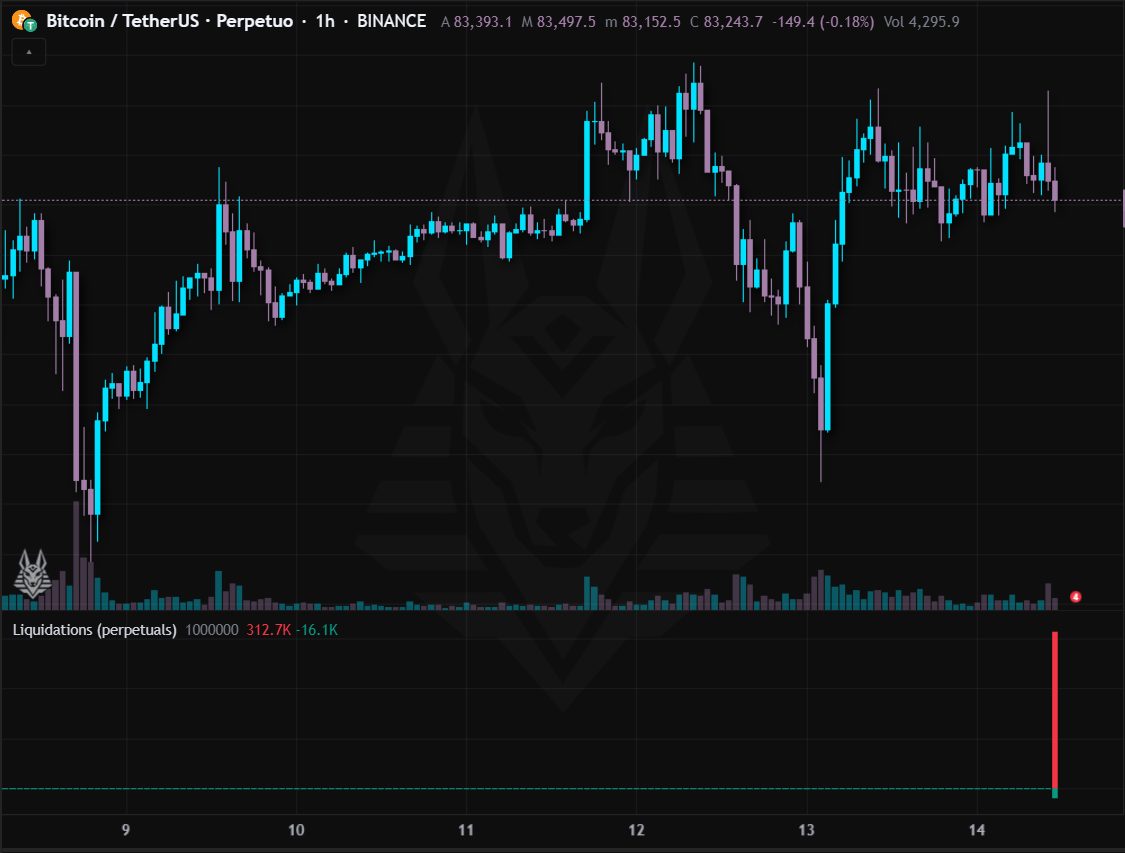
Value of the liquidated positions per bar: liquidated longs in red above zero, shorts in green below. The server collects them in real time: the history starts from when it was switched on (up to 30 days).
- Peaks of long liquidations often coincide with a low (capitulation), those of shorts with a high.
- A cascade of liquidations speeds up the moves.
Settings: Alert threshold (value, 1,000,000 by default). Alerts: Liquidations above the threshold.