Indicators describe what the price is doing: they are not trading advice and no indicator works on its own. Every one can be added from .
Indicators that show the direction and strength of the trend. They are usually read on the price (overlay), except the ADX.
Moving averages (EMA 20/50/200)
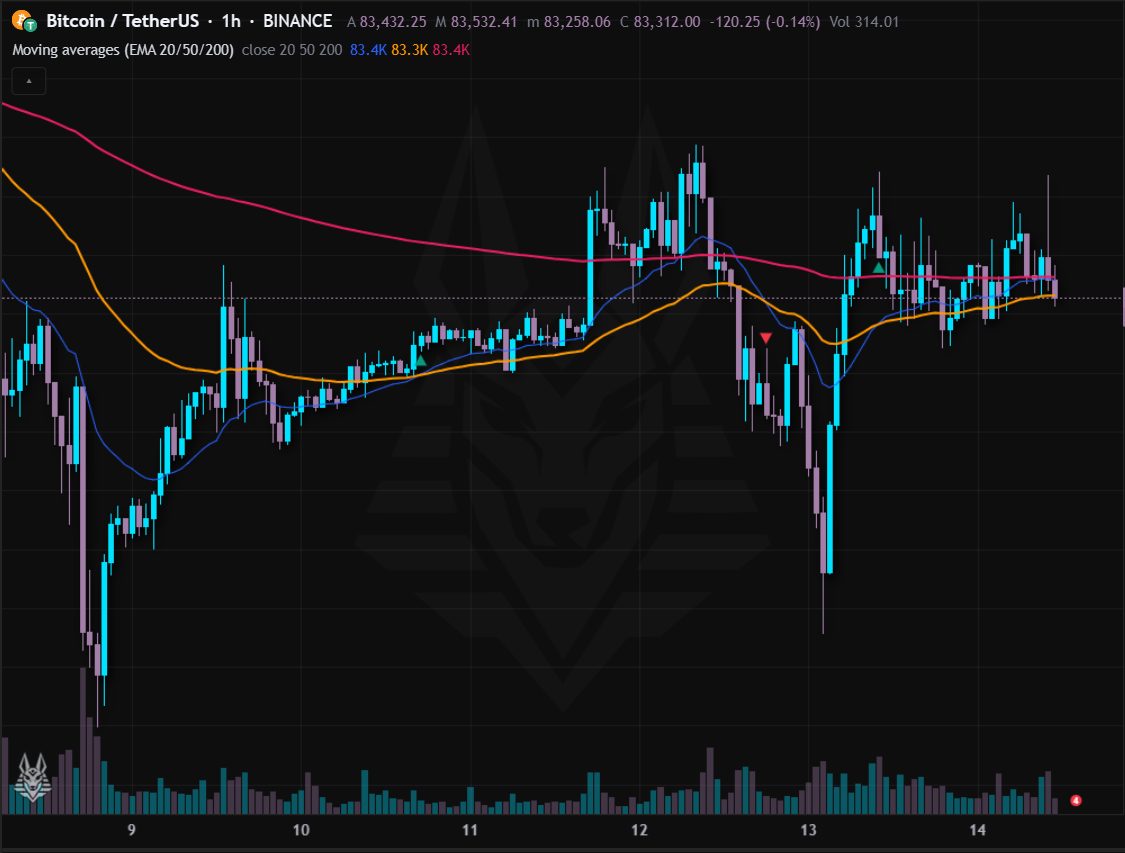
Three exponential moving averages (EMA) on the price: 20 (fast), 50 (mid) and 200 (slow). They follow the price while smoothing the noise: the longer the period, the slower the line.
- Price above the averages and the averages ordered 20 > 50 > 200: uptrend; the opposite: downtrend.
- The averages act as dynamic support or resistance: in trends the price often bounces off the 20 or the 50.
- The green triangle (golden cross) marks the 20 crossing above the 50, the red one (death cross) the 20 crossing below.
Settings: Source and the three periods (20, 50, 200). Alerts: Bullish cross and Bearish cross between the fast and the mid EMA.
Moving average (SMA, EMA, WMA…)
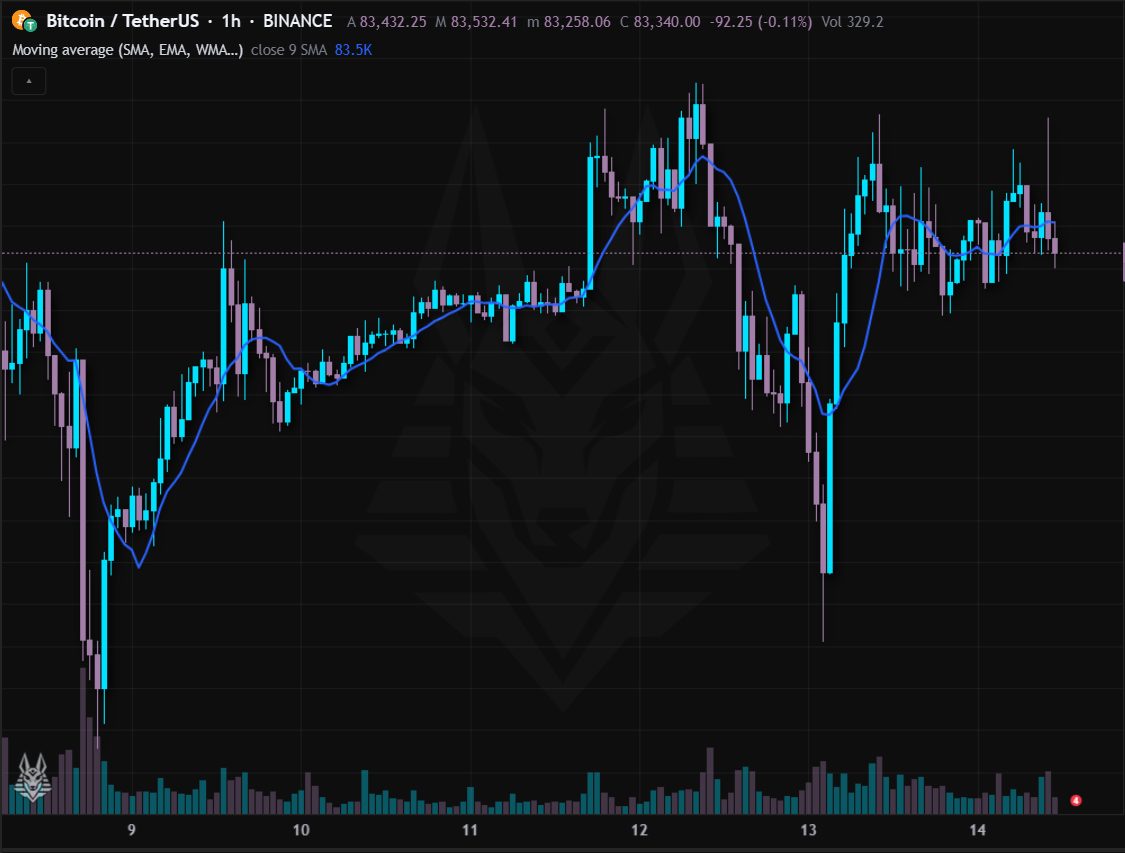
A single moving average whose type you choose: SMA (simple), EMA (exponential), WMA (weighted), RMA (Wilder's), HMA (Hull) or VWMA (volume-weighted).
- Slope and position relative to the price tell the direction of the trend.
- EMA, WMA and HMA react sooner; SMA and RMA are steadier; the VWMA gives more weight to bars with more volume.
Settings: Source, period (9) and type.
Hull moving average
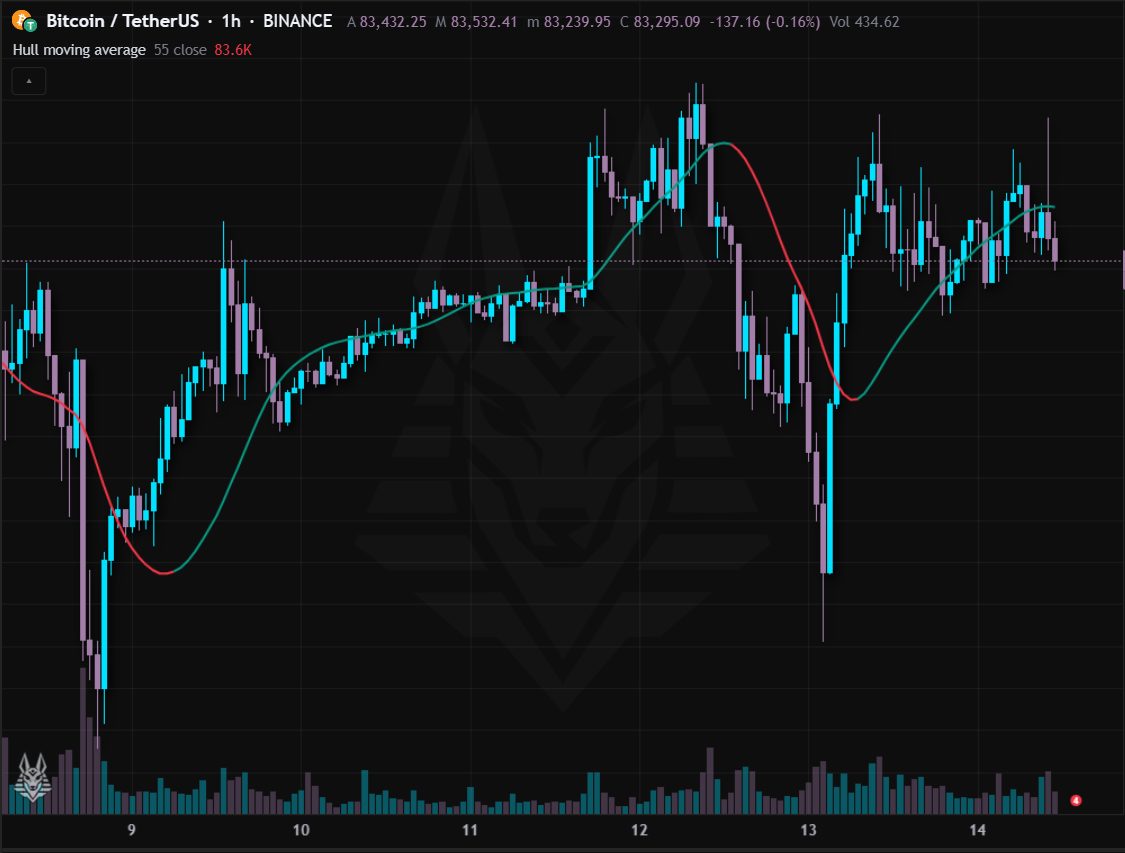
Hull moving average: very responsive yet smooth, with little lag compared with the other averages.
- It turns before the classic averages: handy to see a change of momentum right away.
- With long periods (55 by default) it follows the underlying trend; with short ones it is a fast filter.
Settings: Period (55) and source.
EMA ribbon
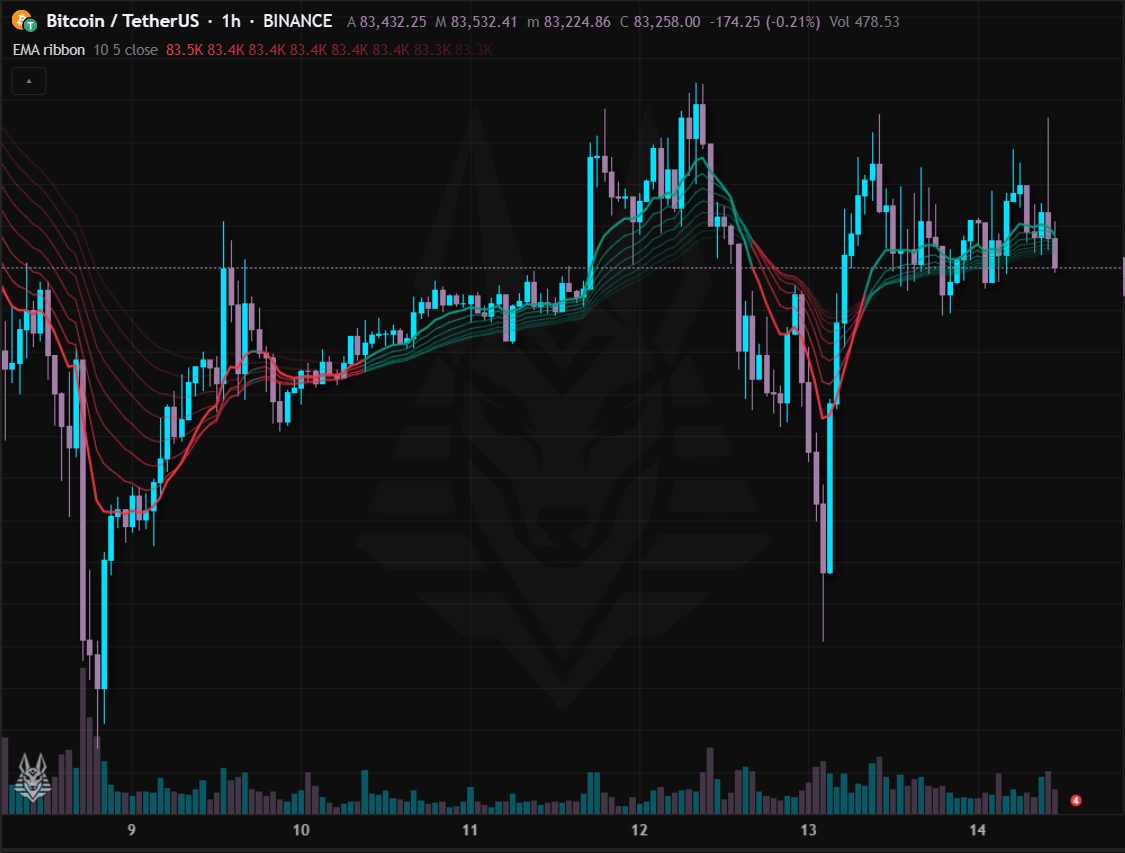
A ribbon of eight EMAs with growing periods (10, 15, 20… in steps of 5). The colour shows the side: green when the fastest is above the slowest, red otherwise.
- Narrow ribbon: no direction or a compressed market; a ribbon that opens up in order: strong trend.
- Lines that tangle together point to a possible change of trend.
Settings: Starting period (10), step (5) and source. Alerts: Bullish ribbon and Bearish ribbon (the fastest EMA crosses the slowest).
Supertrend
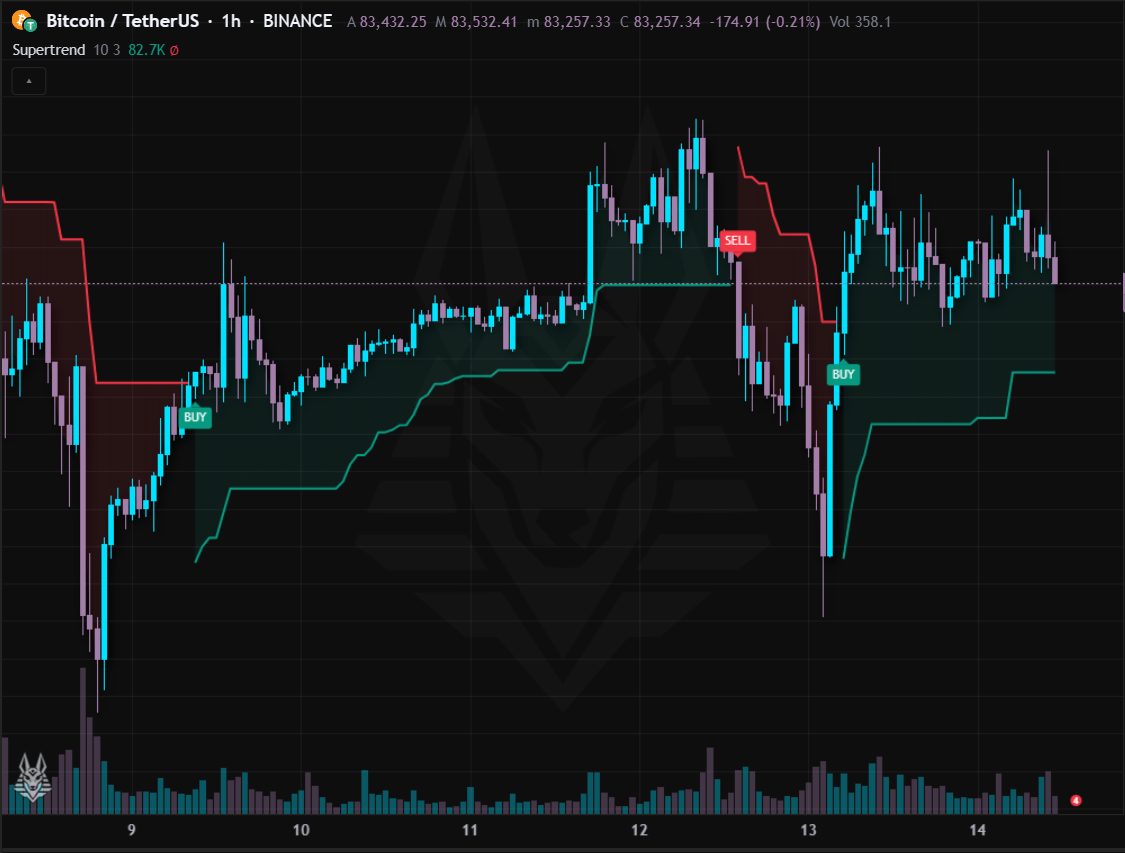
A line that follows the price at a distance of ATR × multiplier: green below the price in uptrends, red above it in downtrends.
- When the price closes beyond the line the trend flips and a triangle appears.
- The line is also a trailing stop: on longs you can keep the stop under the green line.
- In sideways markets it gives many false signals: better to filter it with the ADX.
Settings: ATR period (10) and multiplier (3). Alerts: Supertrend bullish and Supertrend bearish.
Parabolic SAR
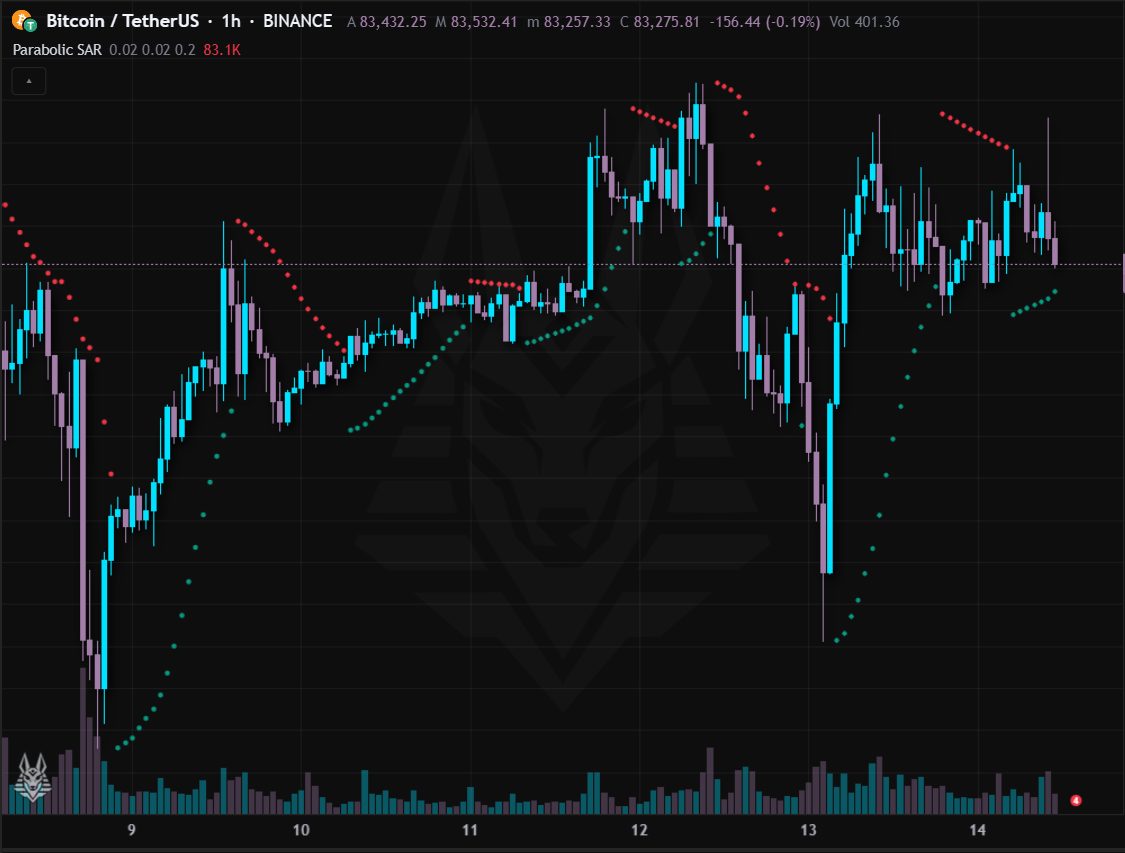
The parabolic SAR: dots below the price in uptrends and above it in downtrends, getting closer and closer to the price.
- The dots jumping to the other side of the price is a reversal.
- As a trailing stop it is very tight: good in strong trends, poor in sideways markets.
Settings: Start (0.02), increment (0.02) and maximum (0.2): the higher they are, the closer and more nervous the SAR. Alerts: Bullish reversal and Bearish reversal.
Ichimoku
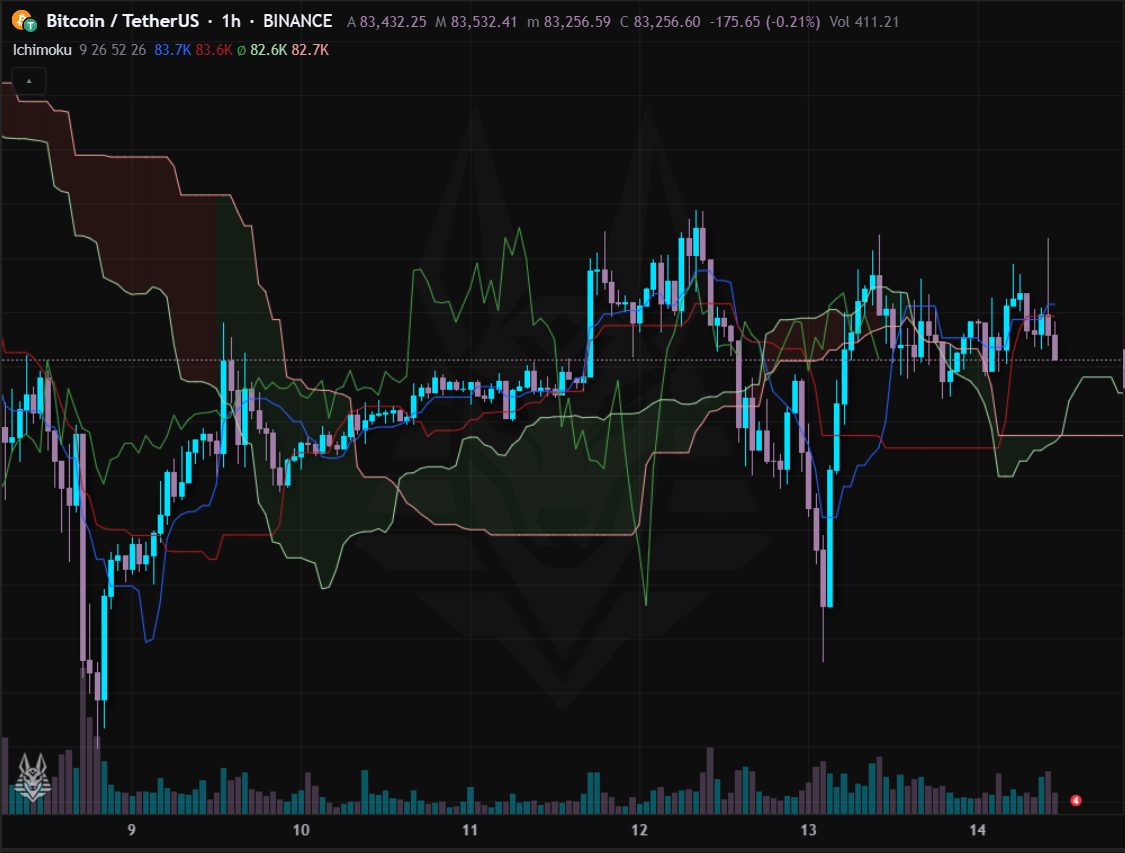
A Japanese system in one indicator: Tenkan (short), Kijun (base), Chikou (the close shifted back) and the cloud (Senkou A and B) shifted forward.
- Price above the cloud: bullish; below: bearish; inside: indecision.
- A thick green cloud = strong support; a thin one = weak level.
- Tenkan crossing above Kijun is a bullish signal (stronger above the cloud).
Settings: Tenkan (9), Kijun (26), Senkou B (52) and displacement (26).
ADX and DMI
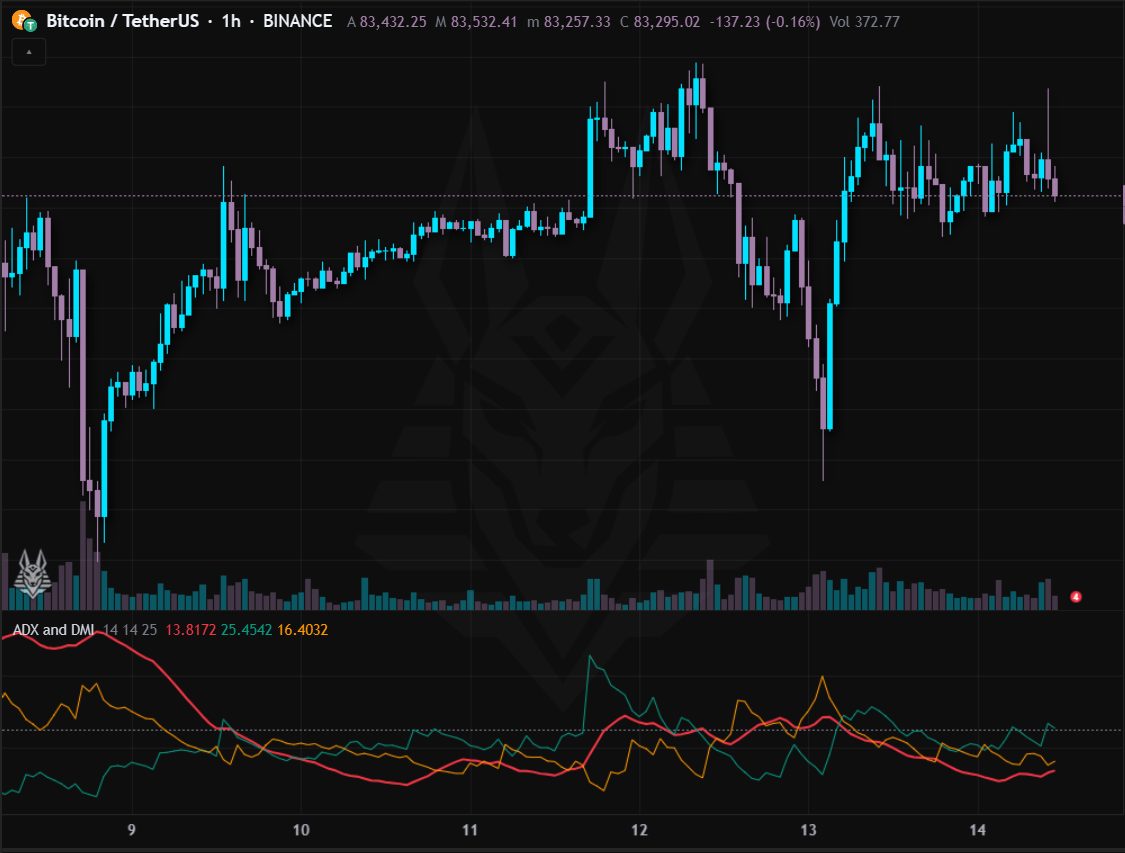
ADX and DMI: the ADX measures the strength of the trend (not its direction), +DI and −DI tell who is pushing, buyers or sellers.
- ADX above 25: there is a trend (threshold adjustable); below: sideways, better avoid trend indicators.
- +DI above −DI: bullish push; −DI above +DI: bearish.
- Rising ADX = the trend is strengthening, falling ADX = it is weakening.
Settings: DI period (14), ADX smoothing (14) and trend threshold (25). Alerts: Trend start: the ADX rises above the threshold.
Linear regression channel
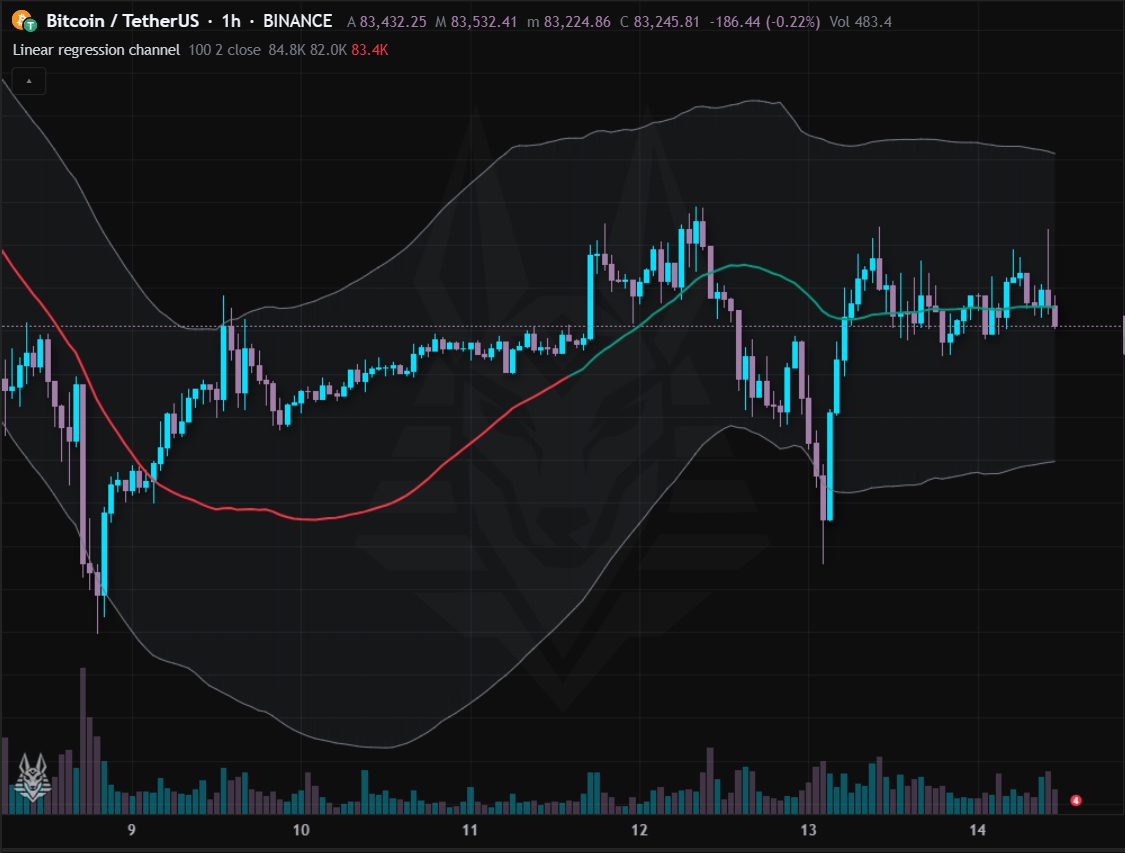
Linear regression channel: the line that best fits the last N prices, with two bands at a distance of standard deviations.
- The slope and colour of the centre line (green rising, red falling) give the direction.
- Price at the upper or lower band is stretched relative to the trend: a possible return to the mean.
- A clear exit from the channel can signal an acceleration or the end of the trend.
Settings: Period (100), standard deviations (2) and source. Alerts: Lower and upper band touch (the price leaves the channel).
Multi-timeframe dashboard
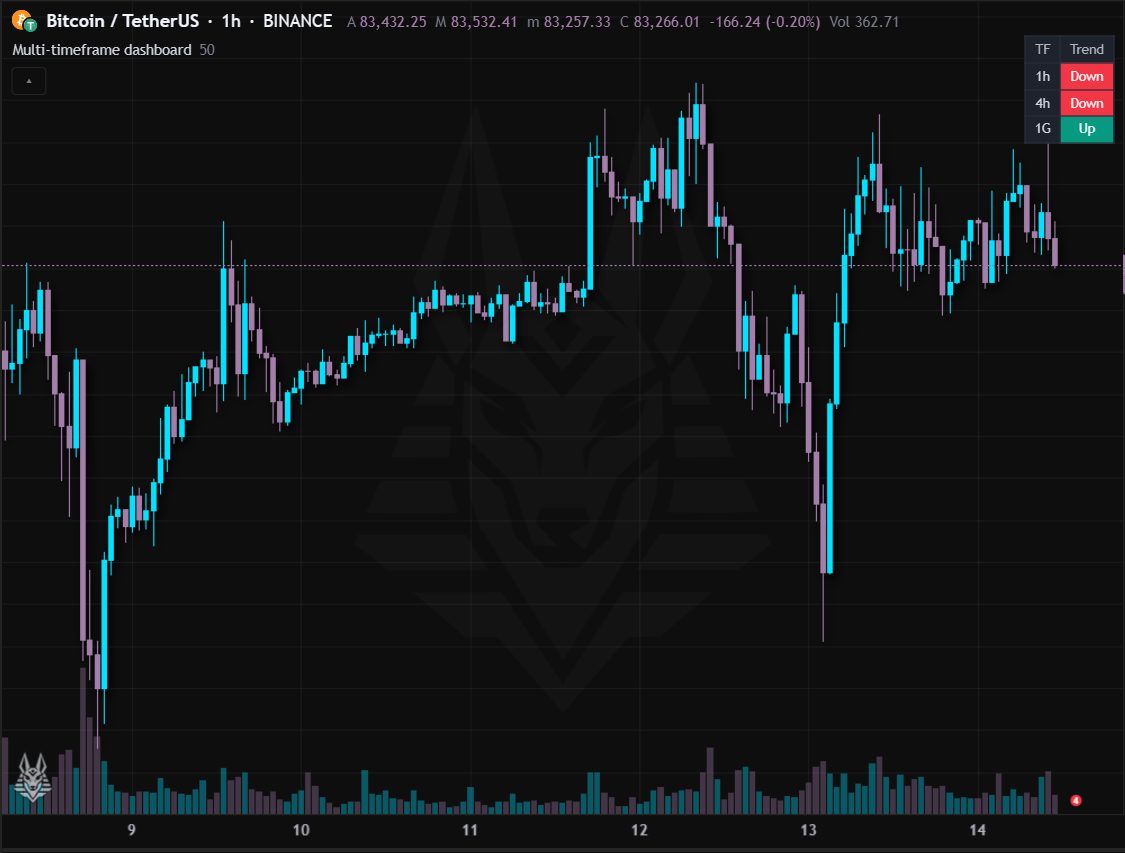
A dashboard in the top right with the trend on 1 hour, 4 hours and daily: for each it says “Up” (green) if the price is above its EMA, “Down” (red) otherwise.
- Three green rows: the trend is aligned on all timeframes, signals in the direction of the trend are more reliable.
- Mixed colours: the timeframes contradict each other, better reduce the risk.
Settings: EMA period (50).