They tell how much the price moves and where it sits relative to its usual range.
Bollinger Bands
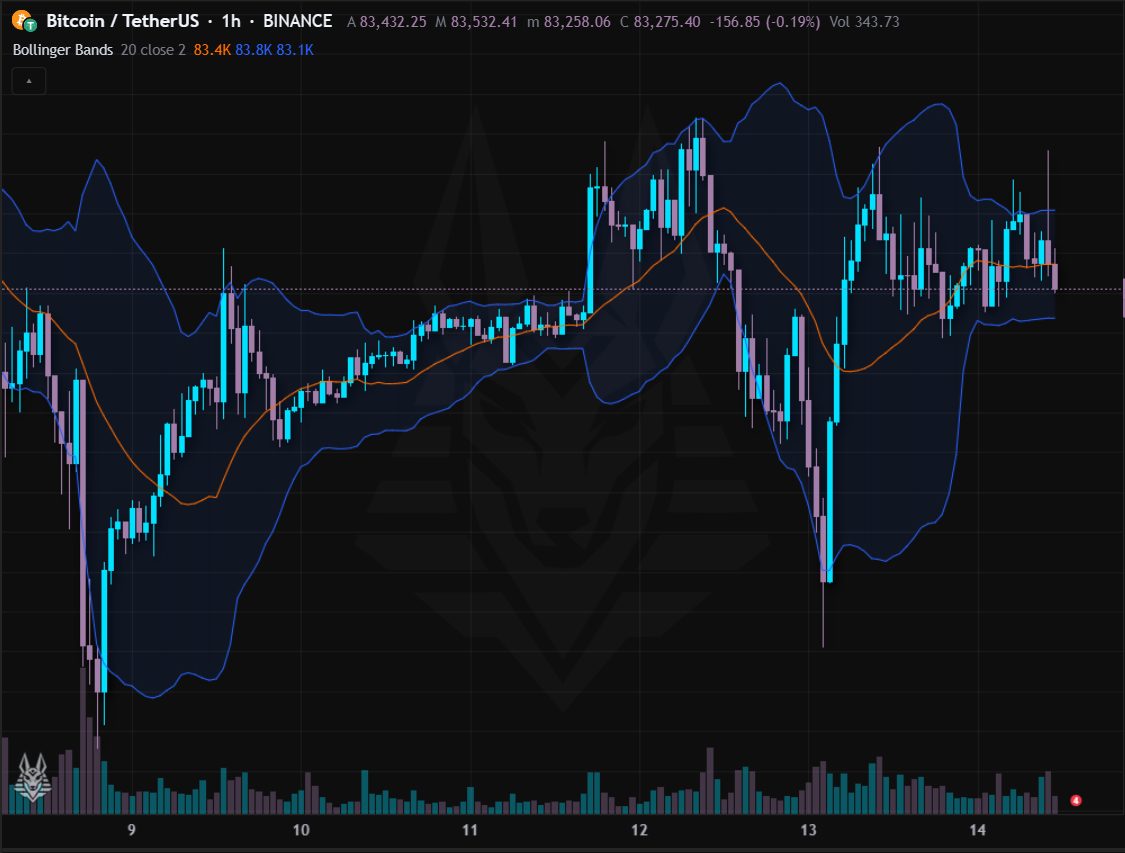
Bollinger Bands: a 20-period moving average with two bands at 2 standard deviations, widening and narrowing with the volatility.
- Narrow bands = low volatility, often before a strong move; wide bands = high volatility.
- Price near the upper or lower band is stretched, but in trends it can “walk” along the band.
- Closes outside the band have a ready alert.
Settings: Period (20), source and standard deviations (2). Alerts: Upper band breakout and Lower band breakout.
Keltner Channels
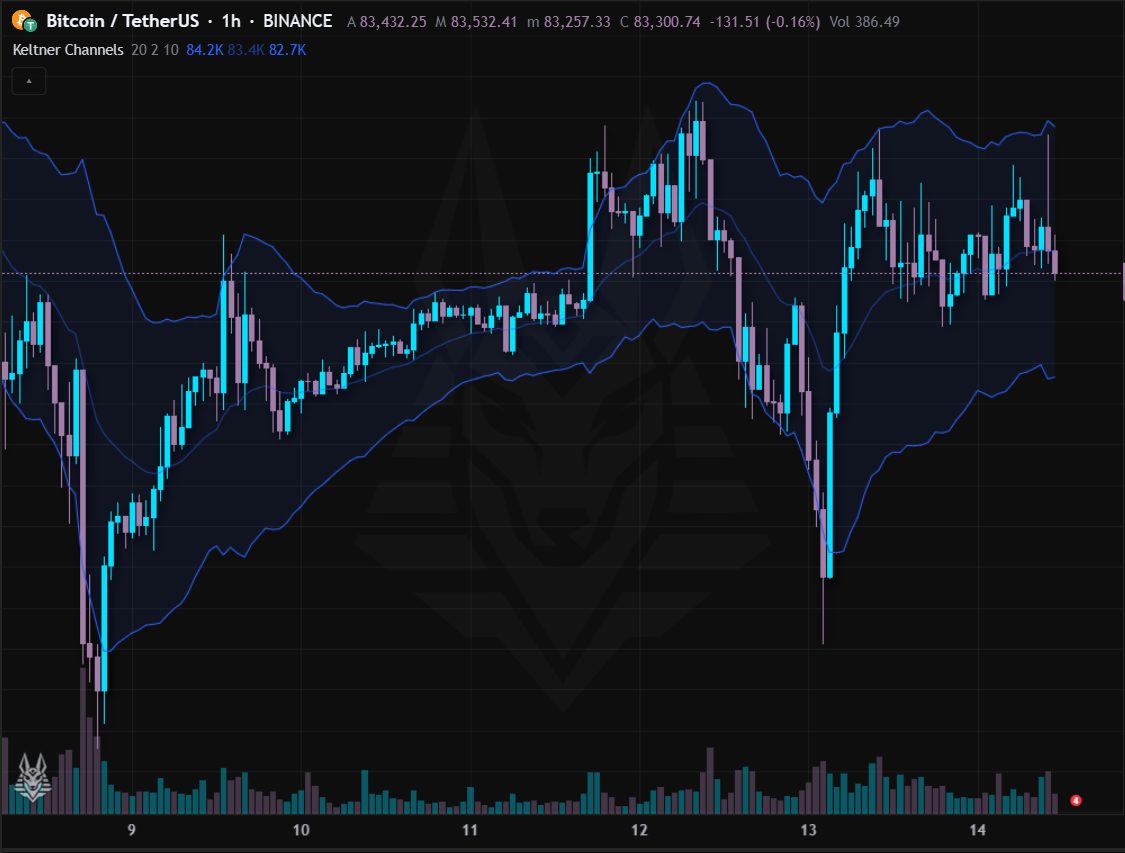
Keltner Channels: a central EMA with two bands at a distance of ATR × multiplier. Smoother than the Bollinger bands, because the ATR changes more gently than the standard deviation.
- Closes beyond the upper band: strength of the trend; beyond the lower: weakness.
- The return to the middle line is the typical pullback.
Settings: Period (20), multiplier (2) and ATR period (10).
Donchian Channel
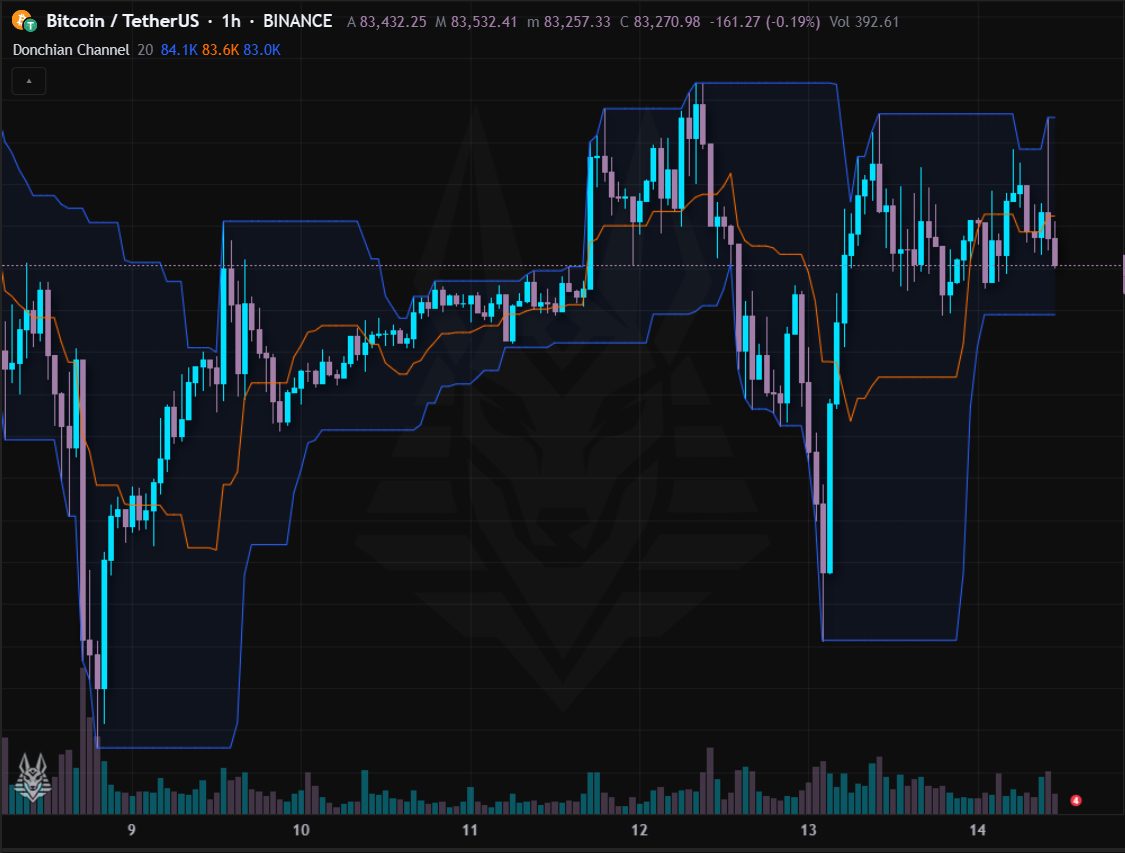
Donchian Channel: the high and the low of the last N bars, with the middle line.
- A break of the high is the basis of breakout systems (like the “turtle traders”).
- A narrowing channel shows compression, a widening one a trending phase.
Settings: Period (20).
ATR (Average True Range)
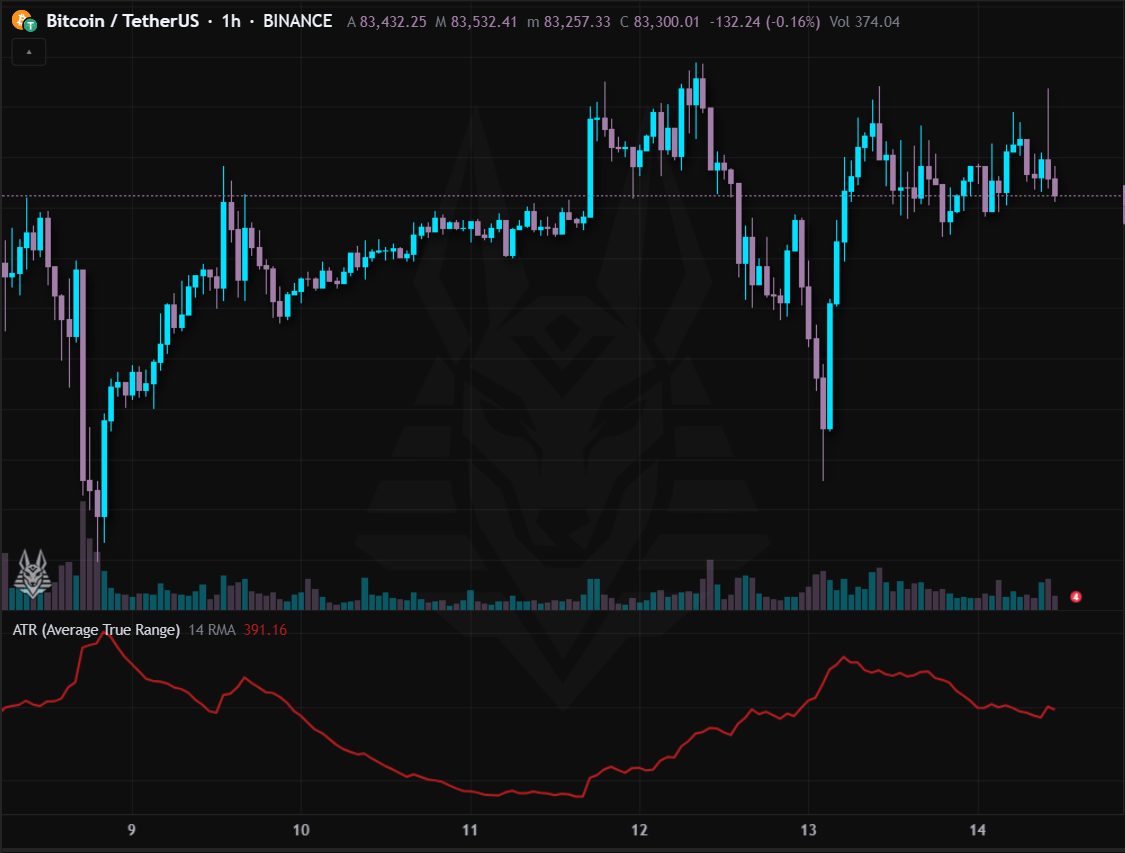
Average True Range: the average volatility of a bar, in price units.
- It gives no direction: it is used to size stops (for example 2 × ATR) and the position size.
- Rising ATR = a more active market; falling = a calmer one.
Settings: Period (14) and type of average (RMA, SMA, EMA, WMA).