Price levels, trendlines, patterns and zones that the indicator draws on the chart by itself.
Highs and lows (pivots)
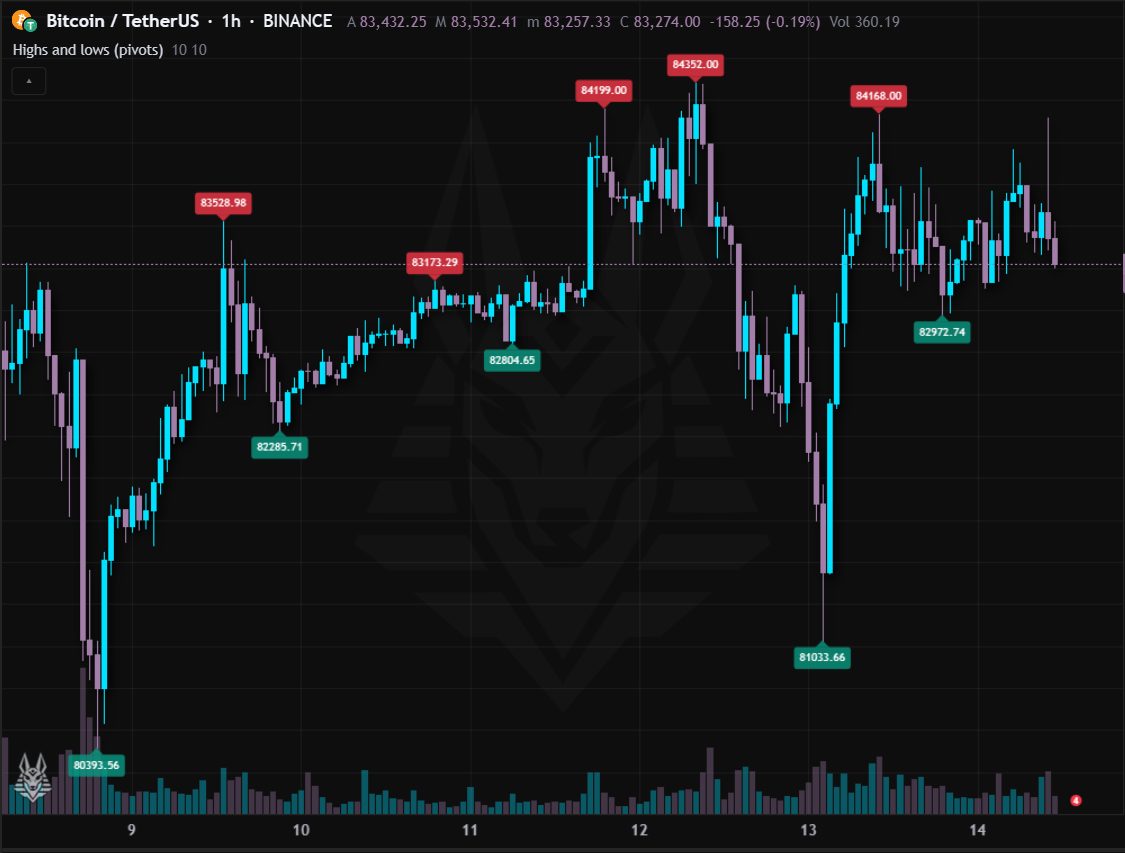
Marks with a label the local highs and lows (pivots): a high is a pivot if none of the N bars to its left and right exceeds it.
- Pivots are the points from which supports, resistances and trendlines are drawn.
- They appear with a delay of N bars (the “bars to the right”): the price to pay for having them confirmed.
Settings: Bars to the left (10) and to the right (10).
Daily pivot points (classic)
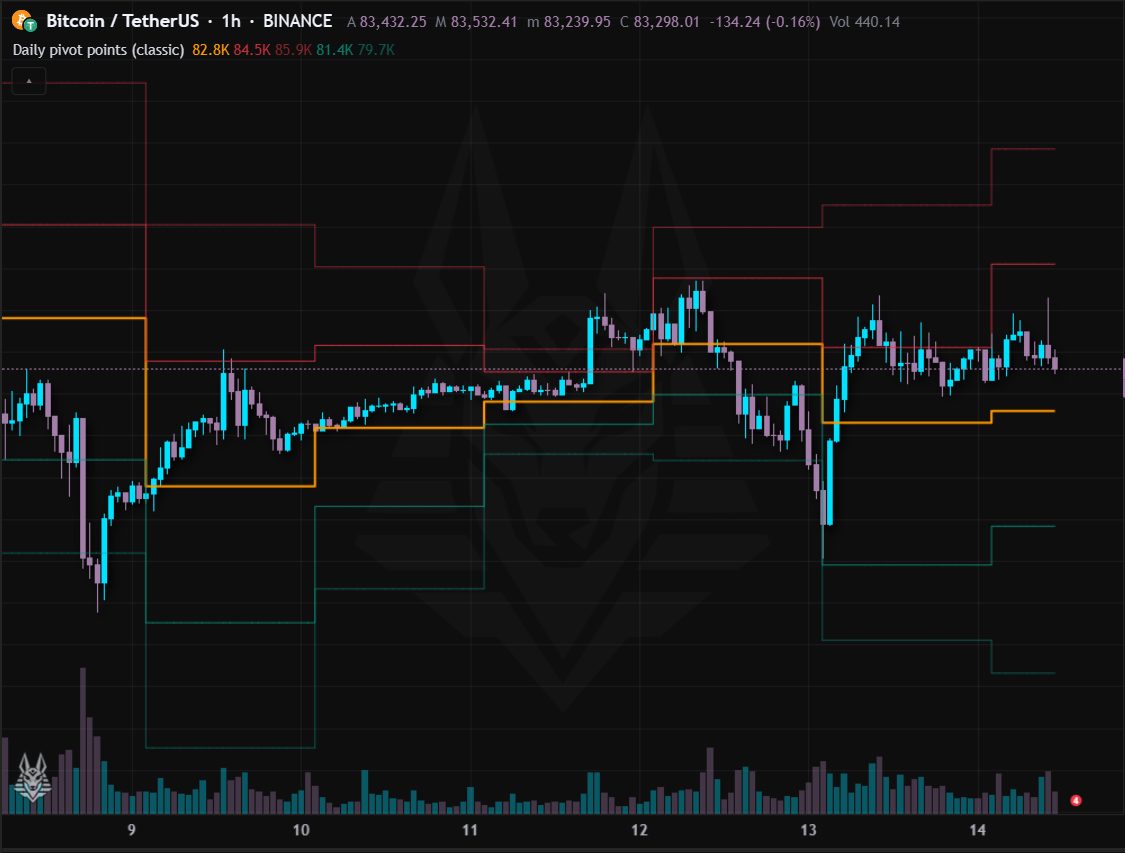
Daily pivot points: calculated from the previous day's high, low and close, they give the central level P, two supports (S1, S2) and two resistances (R1, R2).
- They are levels watched by many traders: the price respects or breaks them with clear reactions.
- Above P the bias of the day is bullish, below it bearish.
Settings: None.
Automatic Fibonacci
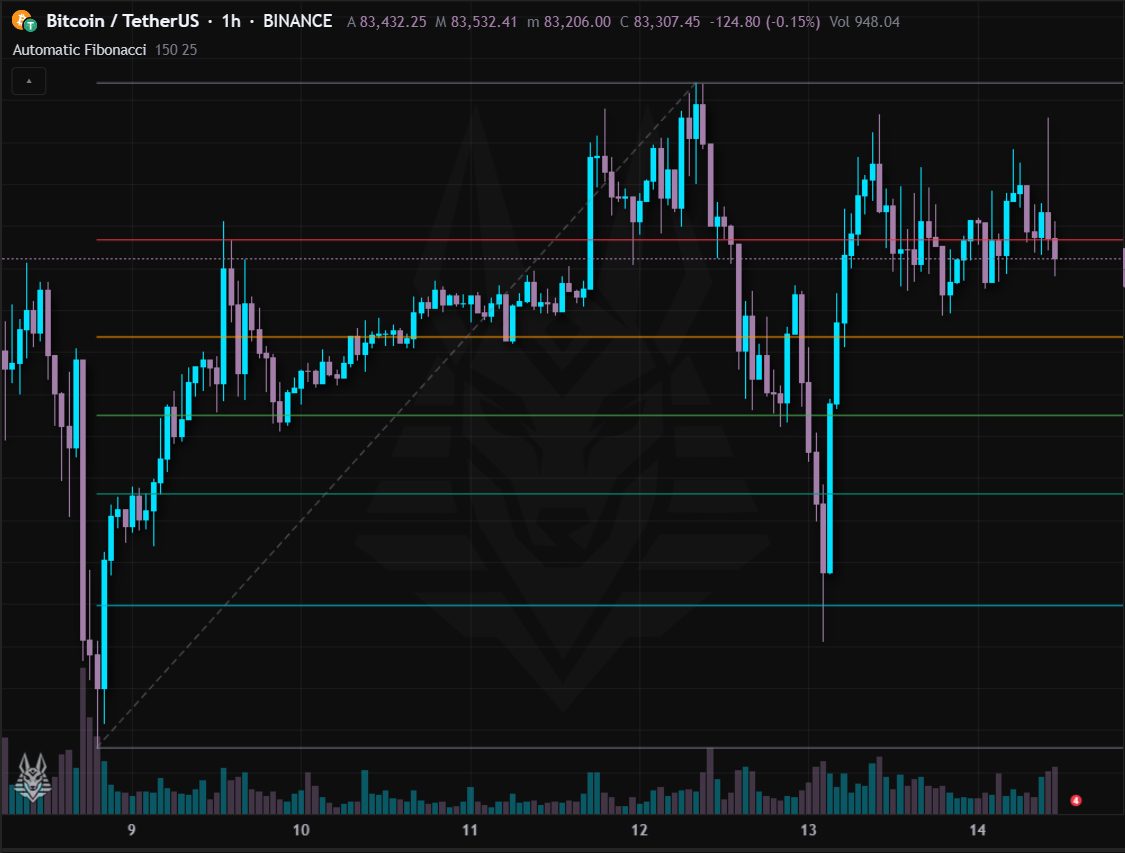
Fibonacci retracements drawn automatically between the low and the high of the last N bars, with the 1.272 and 1.618 extensions. It updates on the last bar.
- The 38.2%, 50% and 61.8% levels are the most watched retracement zones.
- The extensions are possible targets if the price breaks the high (or the low).
Settings: Bars for low and high (150), right extension (25 bars), extensions 1.272 and 1.618, labels with prices.
Automatic trendlines
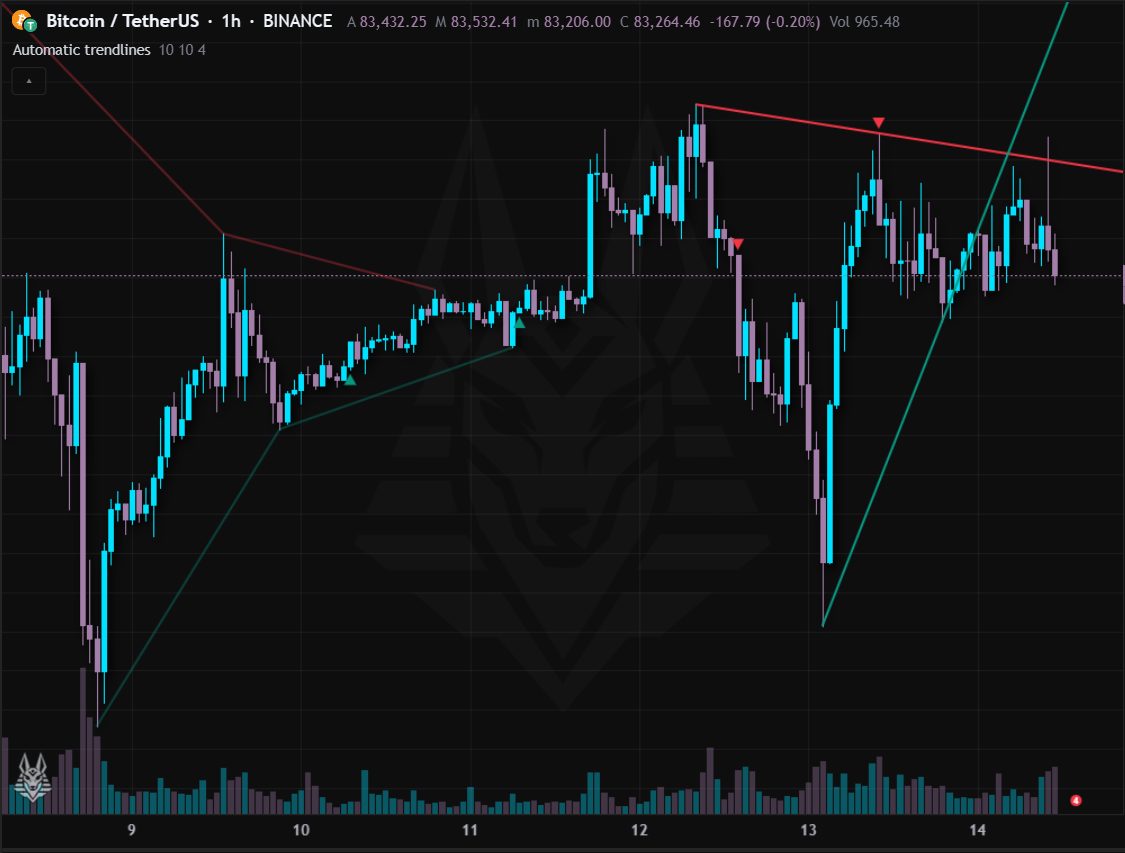
Automatic trendlines: the resistance runs through the last two falling highs, the support through the last two rising lows (pivots), extended to the right. Lines already broken stay fainter.
- A triangle marks the breakout of the resistance (green) or of the support (red).
- The more touches a line has, the more significant it is.
Settings: Bars to the left and right of the pivot (10), previous lines to show (4). Alerts: Resistance breakout and Support breakout.
Automatic divergences
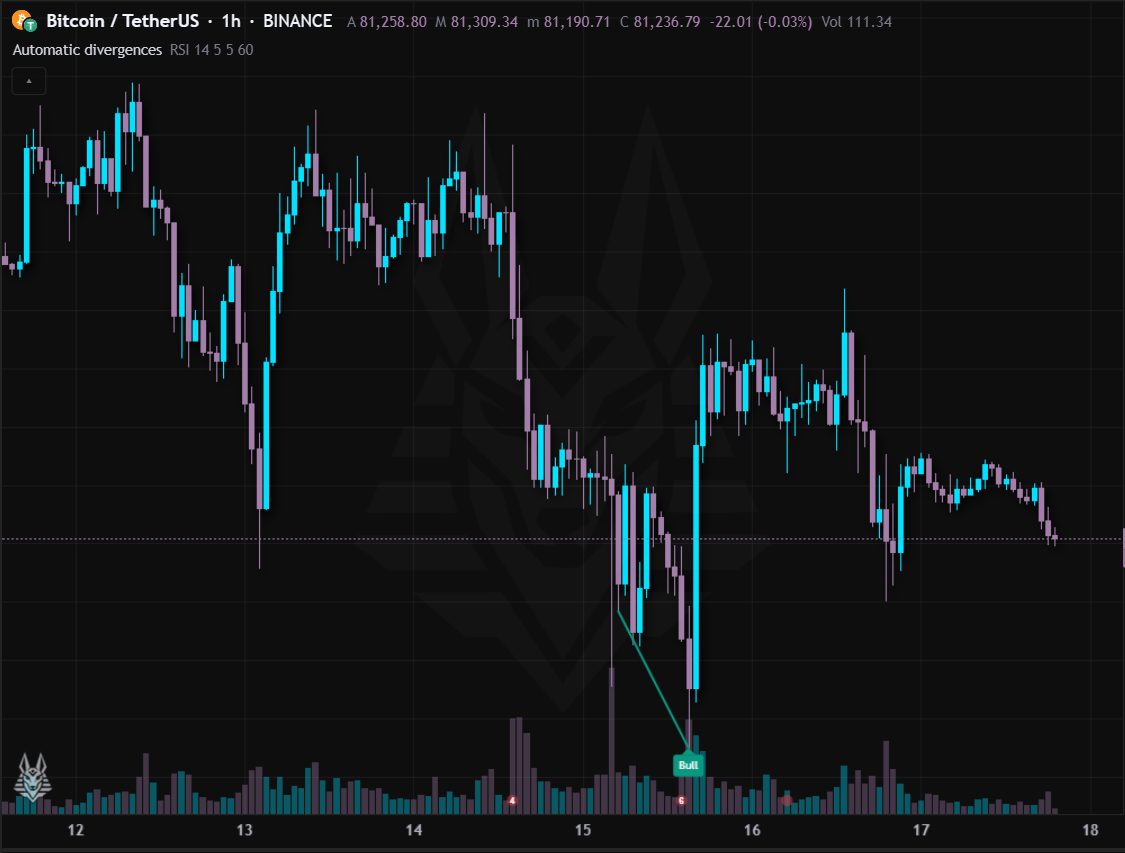
Automatic divergences between the price and an oscillator of your choice (RSI, MACD, stochastic, CCI, MFI, OBV, ROC): it compares two consecutive oscillator pivots with the price on the same bars and draws the line on the chart.
- Regular bullish (“Bull”): the price makes a lower low but the oscillator a higher one; bearish (“Bear”): a higher high of the price, a lower one of the oscillator. They signal a possible reversal.
- Hidden (“H Bull”, “H Bear”, dashed line): the opposite, signalling a possible continuation of the trend.
- The signal comes after the bars to the right of the pivot, never before: it does not repaint.
Settings: Oscillator (RSI), period (14), bars to the left and right of the pivot (5), maximum distance between pivots (60), regular and hidden divergences, labels. Alerts: Bullish, bearish, hidden bullish, hidden bearish divergence and Any divergence.
Automatic chart patterns
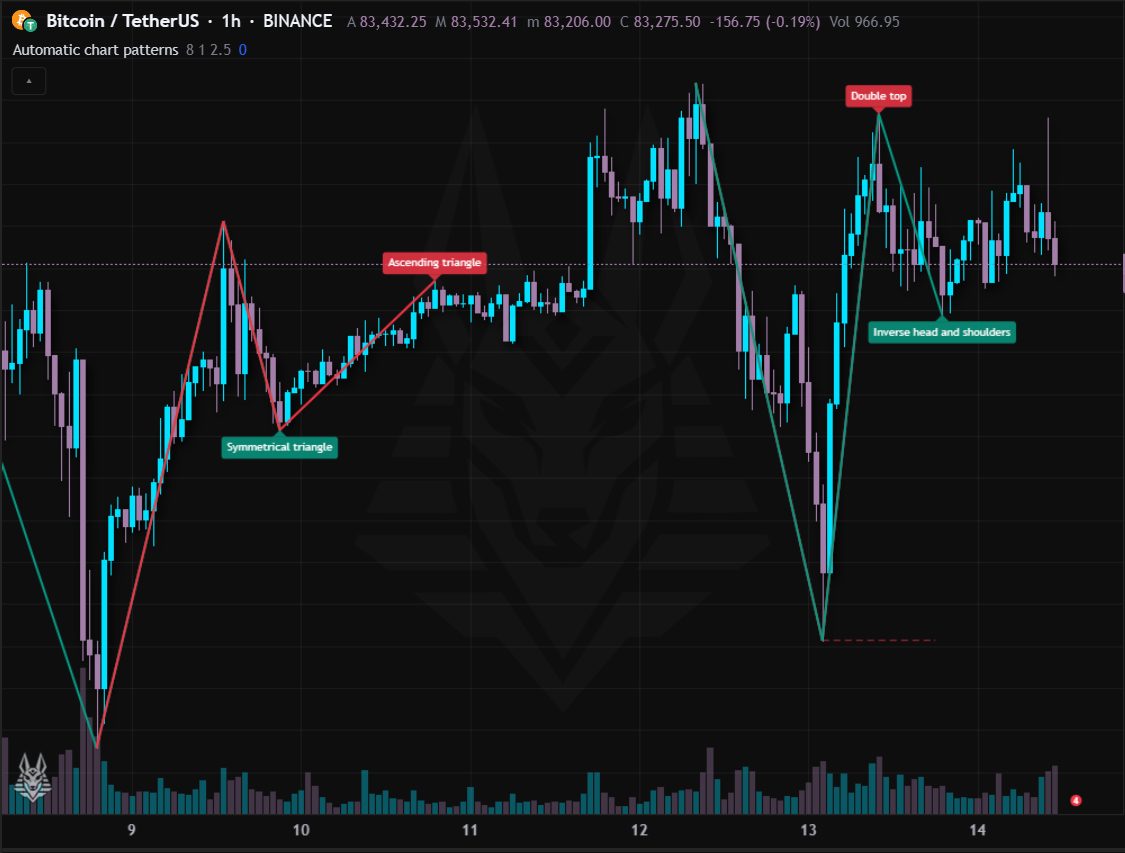
It recognises the classic patterns on pivots: double top and bottom, head and shoulders (also inverse), symmetrical, ascending and descending triangles. It draws the lines, the name and the neckline.
- Bullish patterns (double bottom, inverse head and shoulders, ascending triangle) and bearish ones have different colours.
- They are approximate geometric shapes: always confirm with the neckline break and the volume.
Settings: Pivot width (8), tolerance between similar levels (1%), minimum retracement of doubles and optional zigzag. Alerts: Bullish pattern, Bearish pattern and Any pattern.
Candlestick patterns
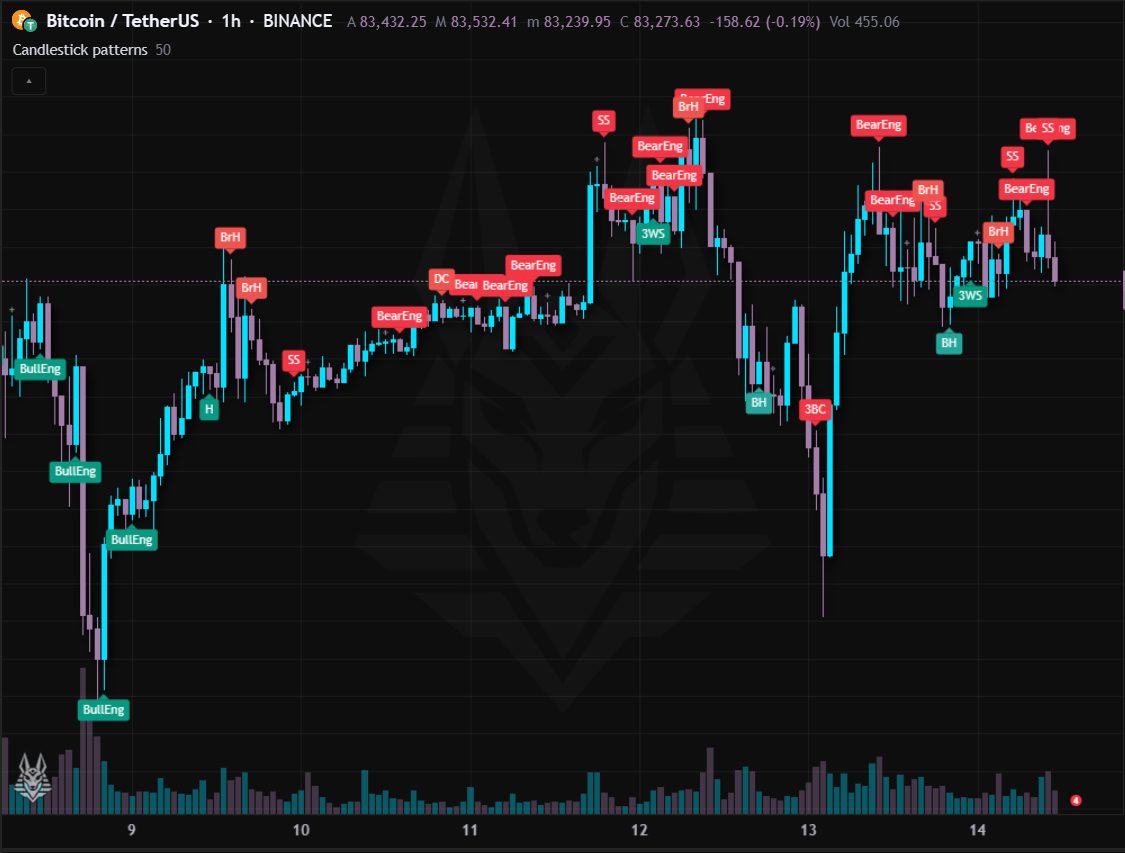
It recognises the main candlestick patterns: engulfing, hammer, shooting star, morning and evening stars, harami, three white soldiers, three black crows and doji. Adapted to markets without gaps like crypto.
- Reversal patterns only count against the current trend (filter with a 50 average): fewer but better signals.
- A pattern alone is not enough: where it appears matters (on a support, a resistance, after an excess).
Settings: Trend filter (on) and trend average (50). Alerts: One per pattern (engulfing, hammer, shooting star, morning and evening star, doji) plus Bullish and Bearish pattern.
Market structure (BOS/CHoCH)
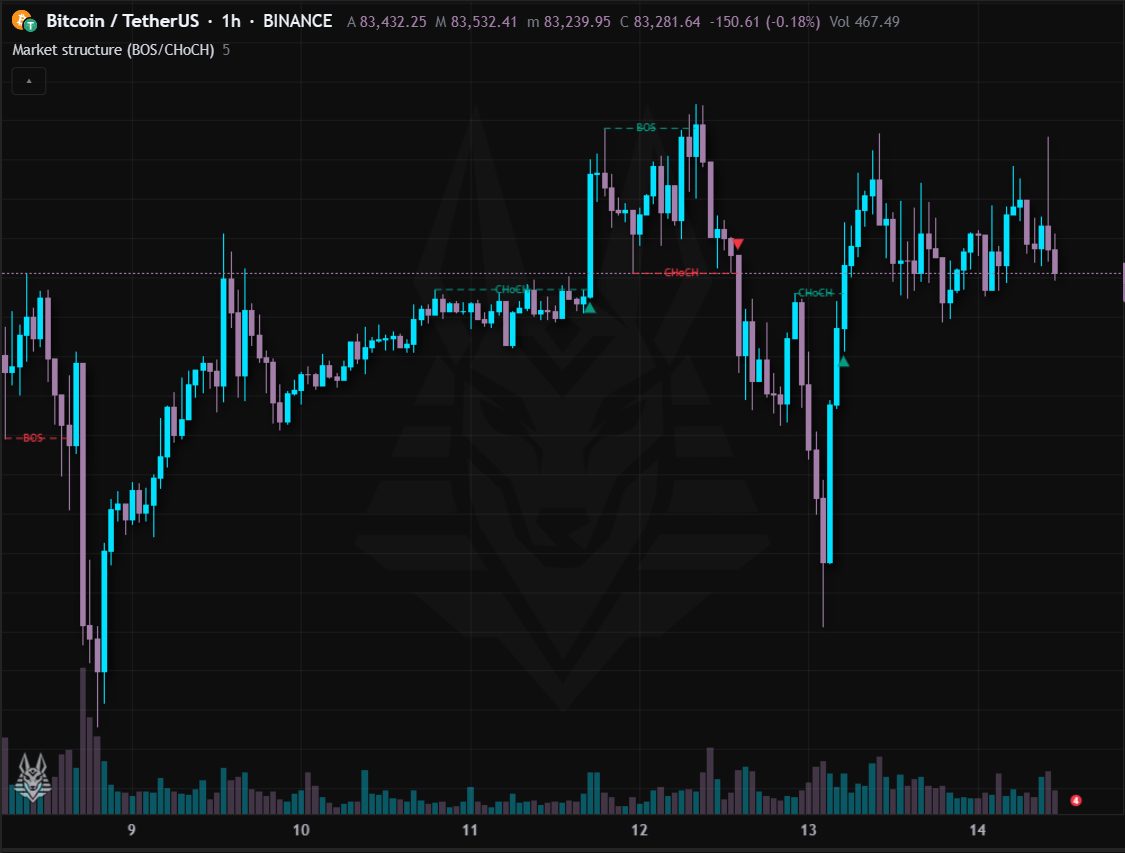
Market structure: it uses pivots to remember the last high and low. BOS (break of structure) = the price closes beyond a high/low in the direction of the trend; CHoCH (change of character) = it breaks it against the trend, a possible change of direction.
- A series of bullish BOS confirms the trend; the first bearish CHoCH after a rise is the first warning of a reversal.
- The dashed lines show the broken level, the triangle marks the CHoCH.
Settings: Pivot width (5 bars). Alerts: Bullish and bearish BOS, bullish and bearish CHoCH.
Fair Value Gap (FVG)
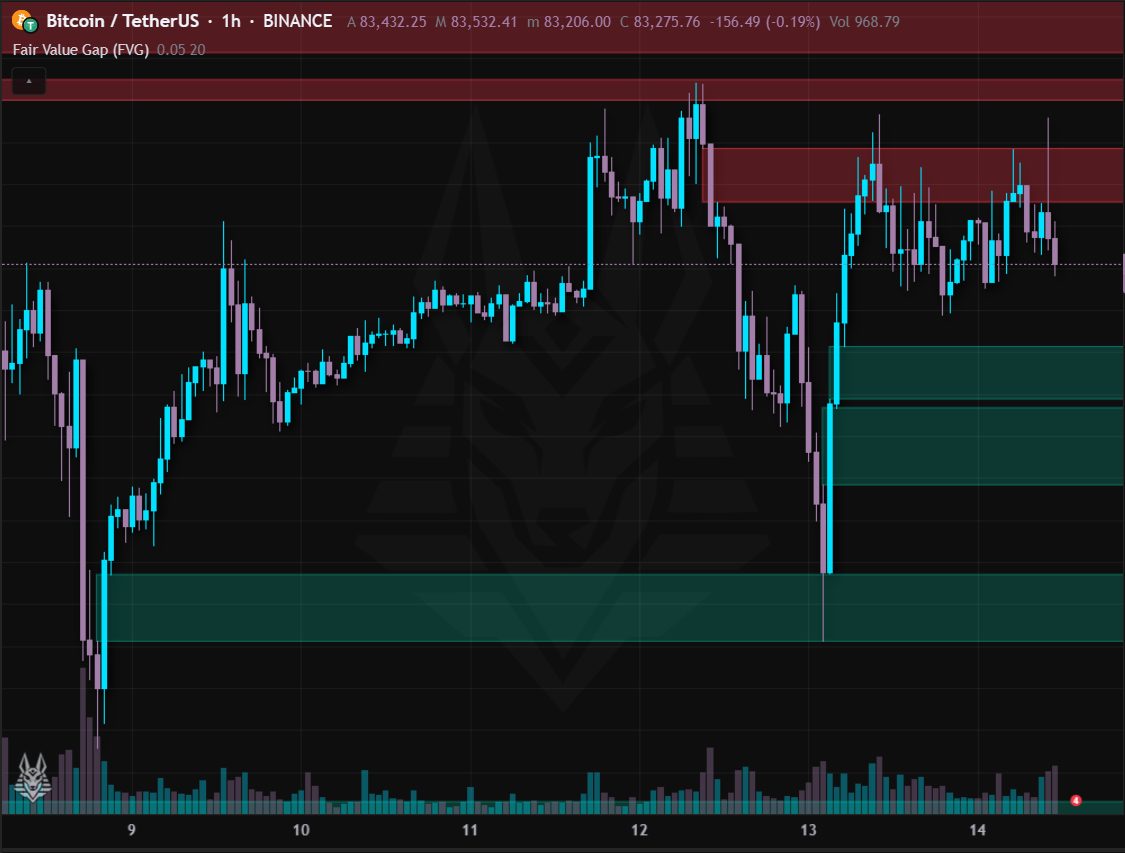
Fair Value Gap: the empty space left when three bars in a row move so fast that the low of the third stays above the high of the first (or the opposite). Drawn as a rectangle, it disappears when the price fills it.
- The price tends to come back and fill the gap: it is used as an entry or reaction zone.
- A bullish gap (green) acts as support, a bearish one (red) as resistance, until it is closed.
Settings: Minimum size (0.05% of the price) and number of gaps to show (20). Alerts: Bullish FVG and Bearish FVG.
Order blocks and supply/demand zones
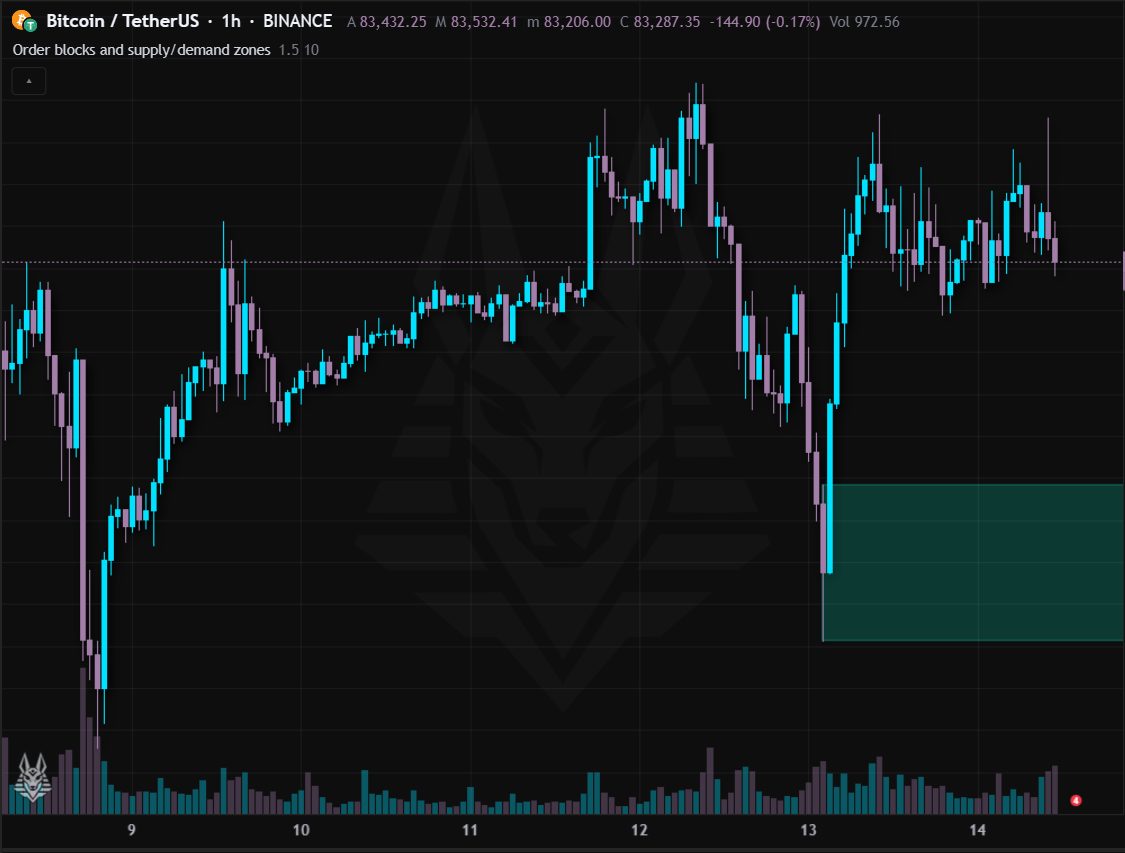
Order block: the last opposite candle before a strong move (beyond 1.5 × ATR). Its range becomes a demand zone (green, after a rise) or a supply zone (red, after a fall), extended to the right until it is broken.
- Unfilled orders are presumed to be left here: the price often reacts when it returns to the zone.
- A zone the price closes beyond on the opposite side disappears: it no longer counts.
Settings: Move strength (1.5 × ATR) and number of zones to show (10). Alerts: New demand zone and New supply zone.