🔎 Screener at the top opens three tabs:
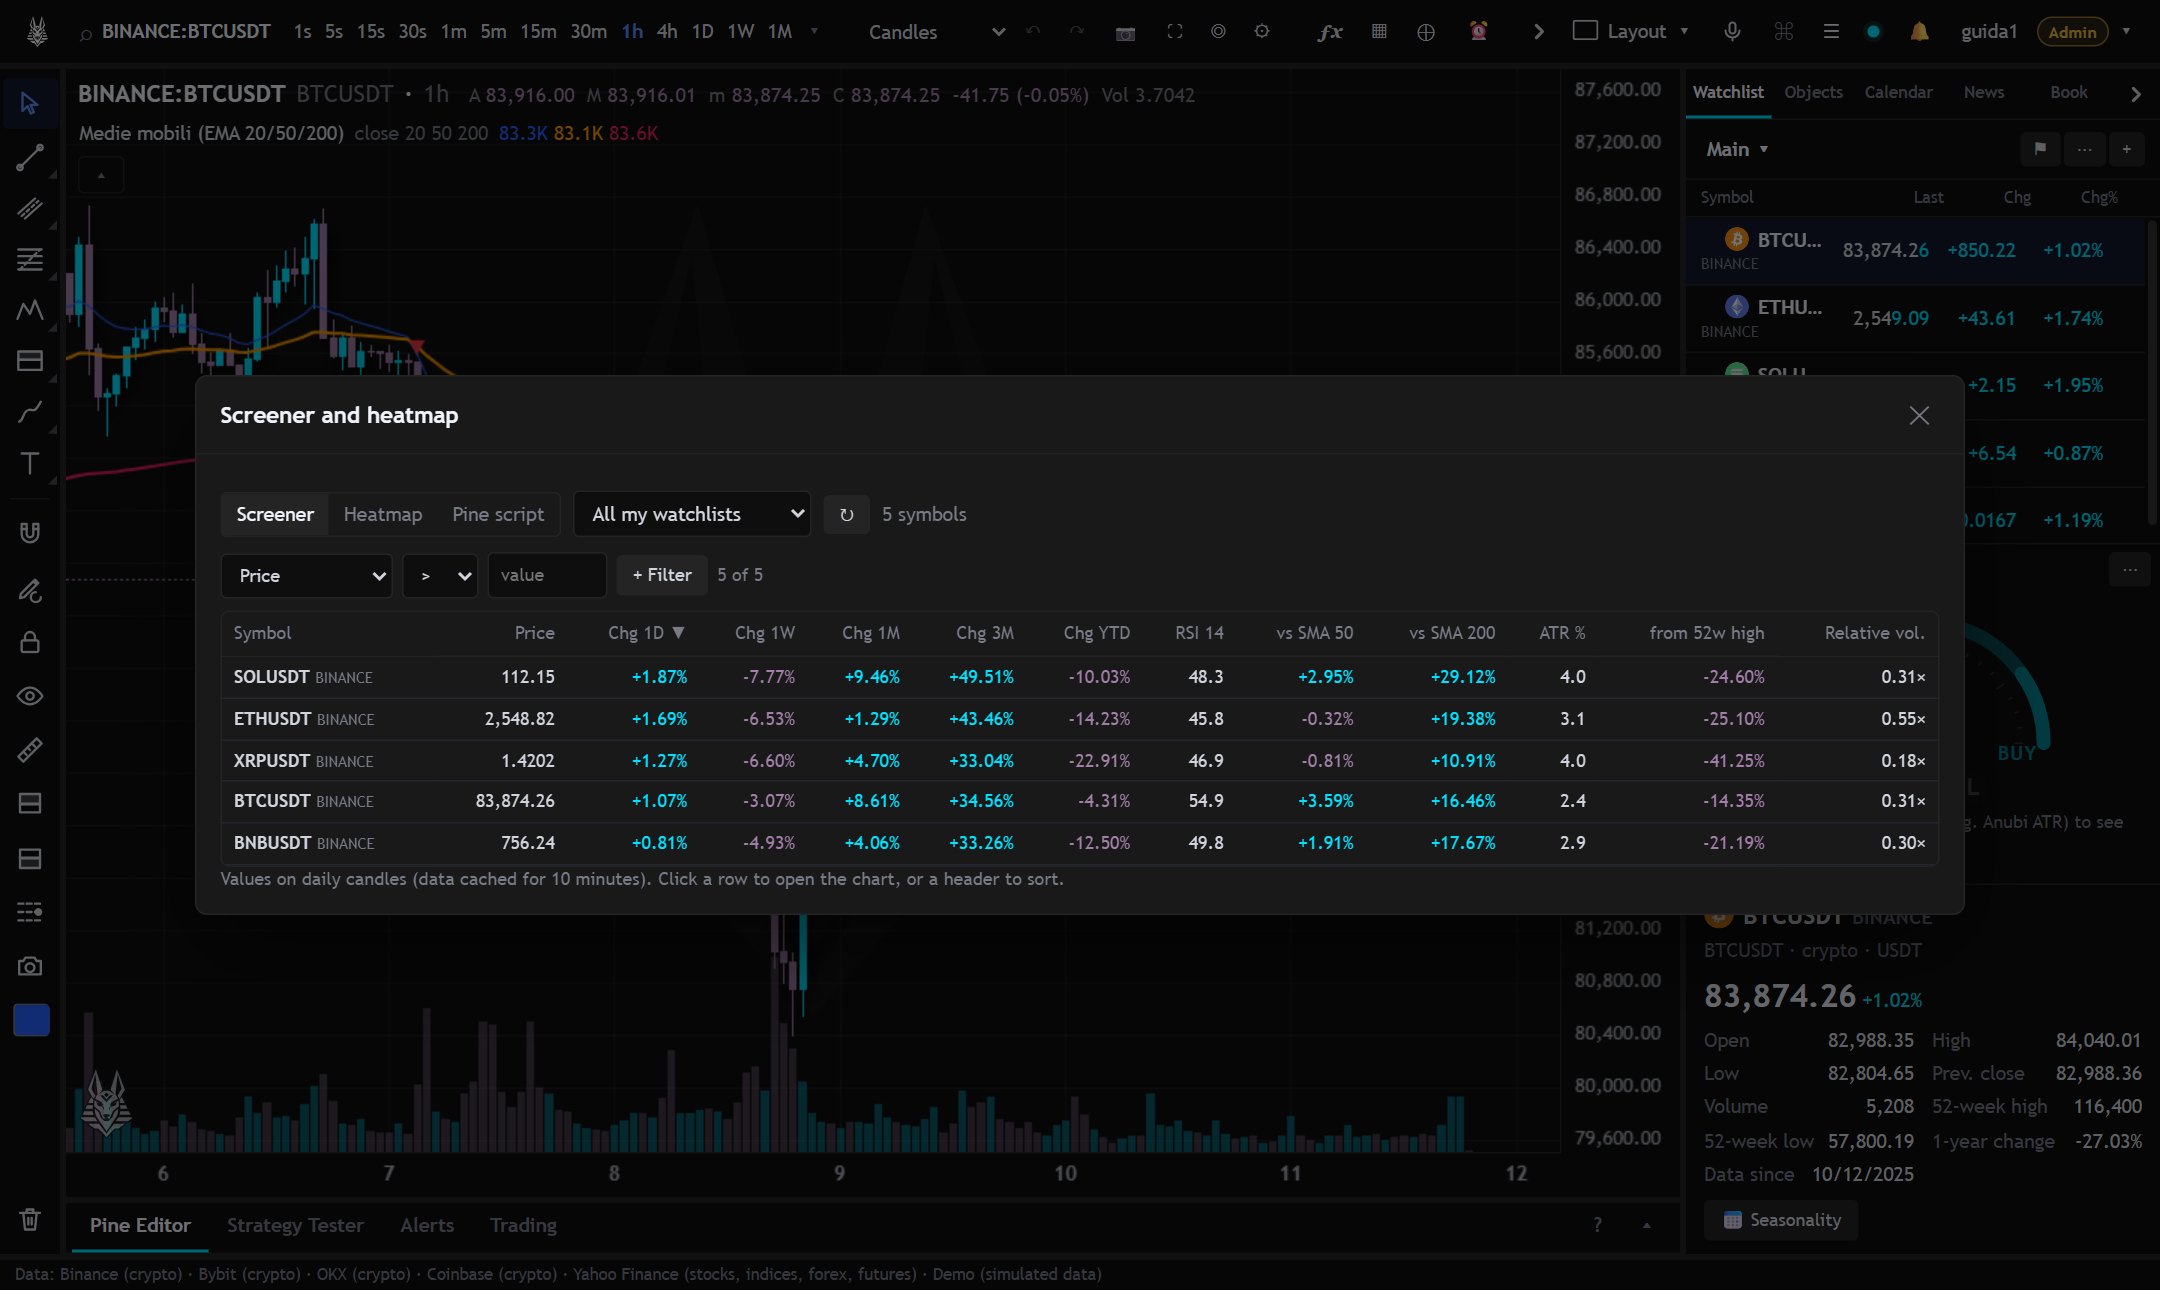
- Screener: table with price, changes (day, week, month, 3 months, year to date), RSI, distance from the 50 and 200 averages, ATR %, distance from the 52-week high and relative volume, filterable and sortable. Symbols come from a watchlist, from all your watchlists or from the main cryptos.
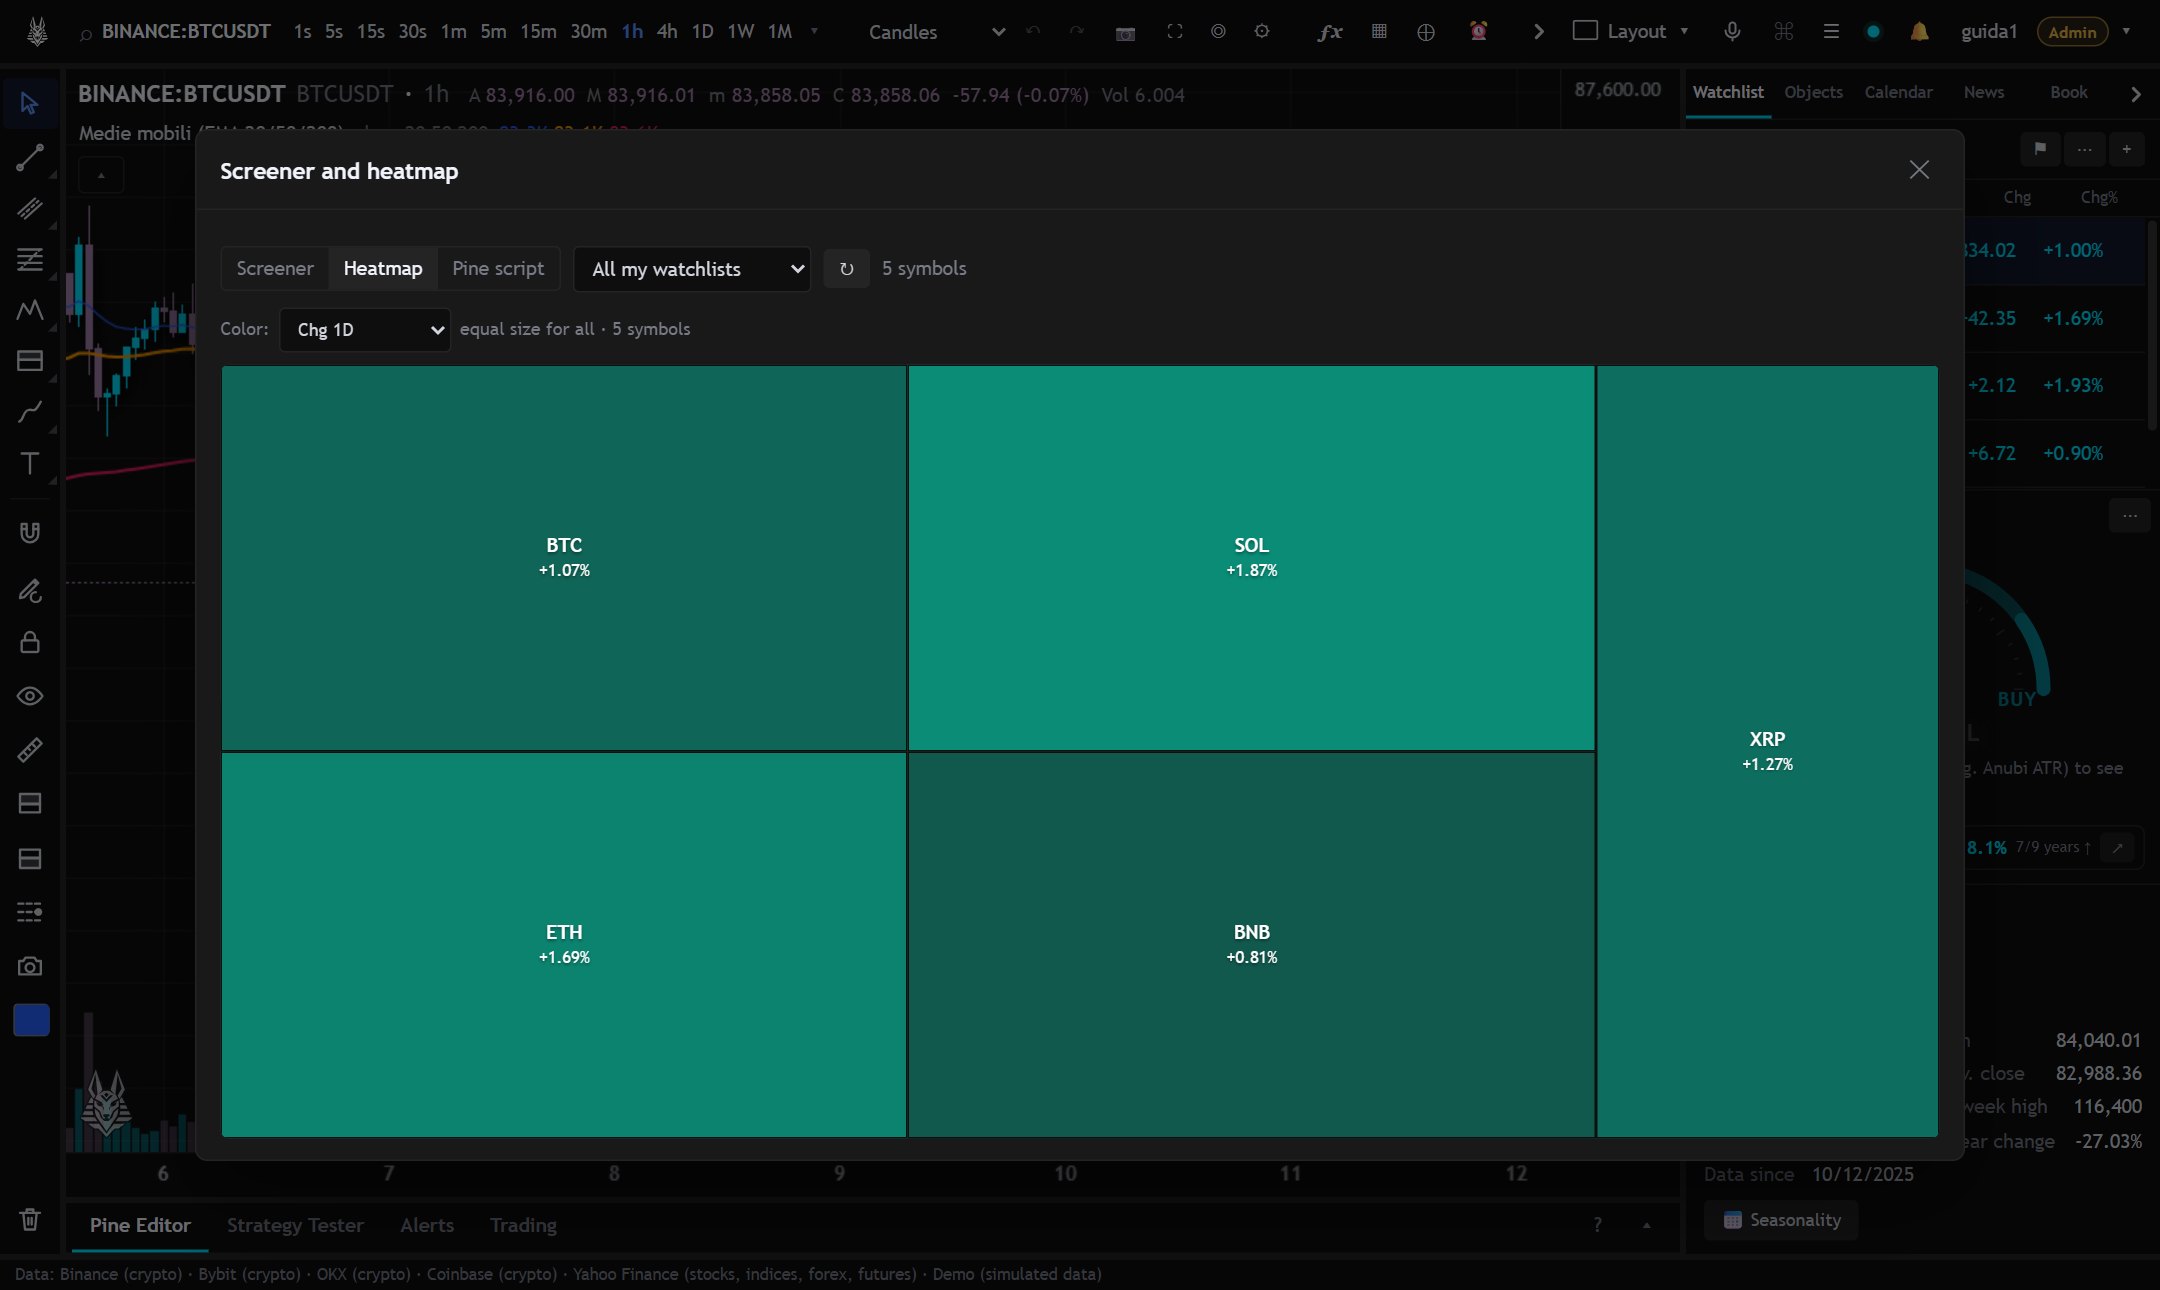
- Heatmap: the changes as a colored map.
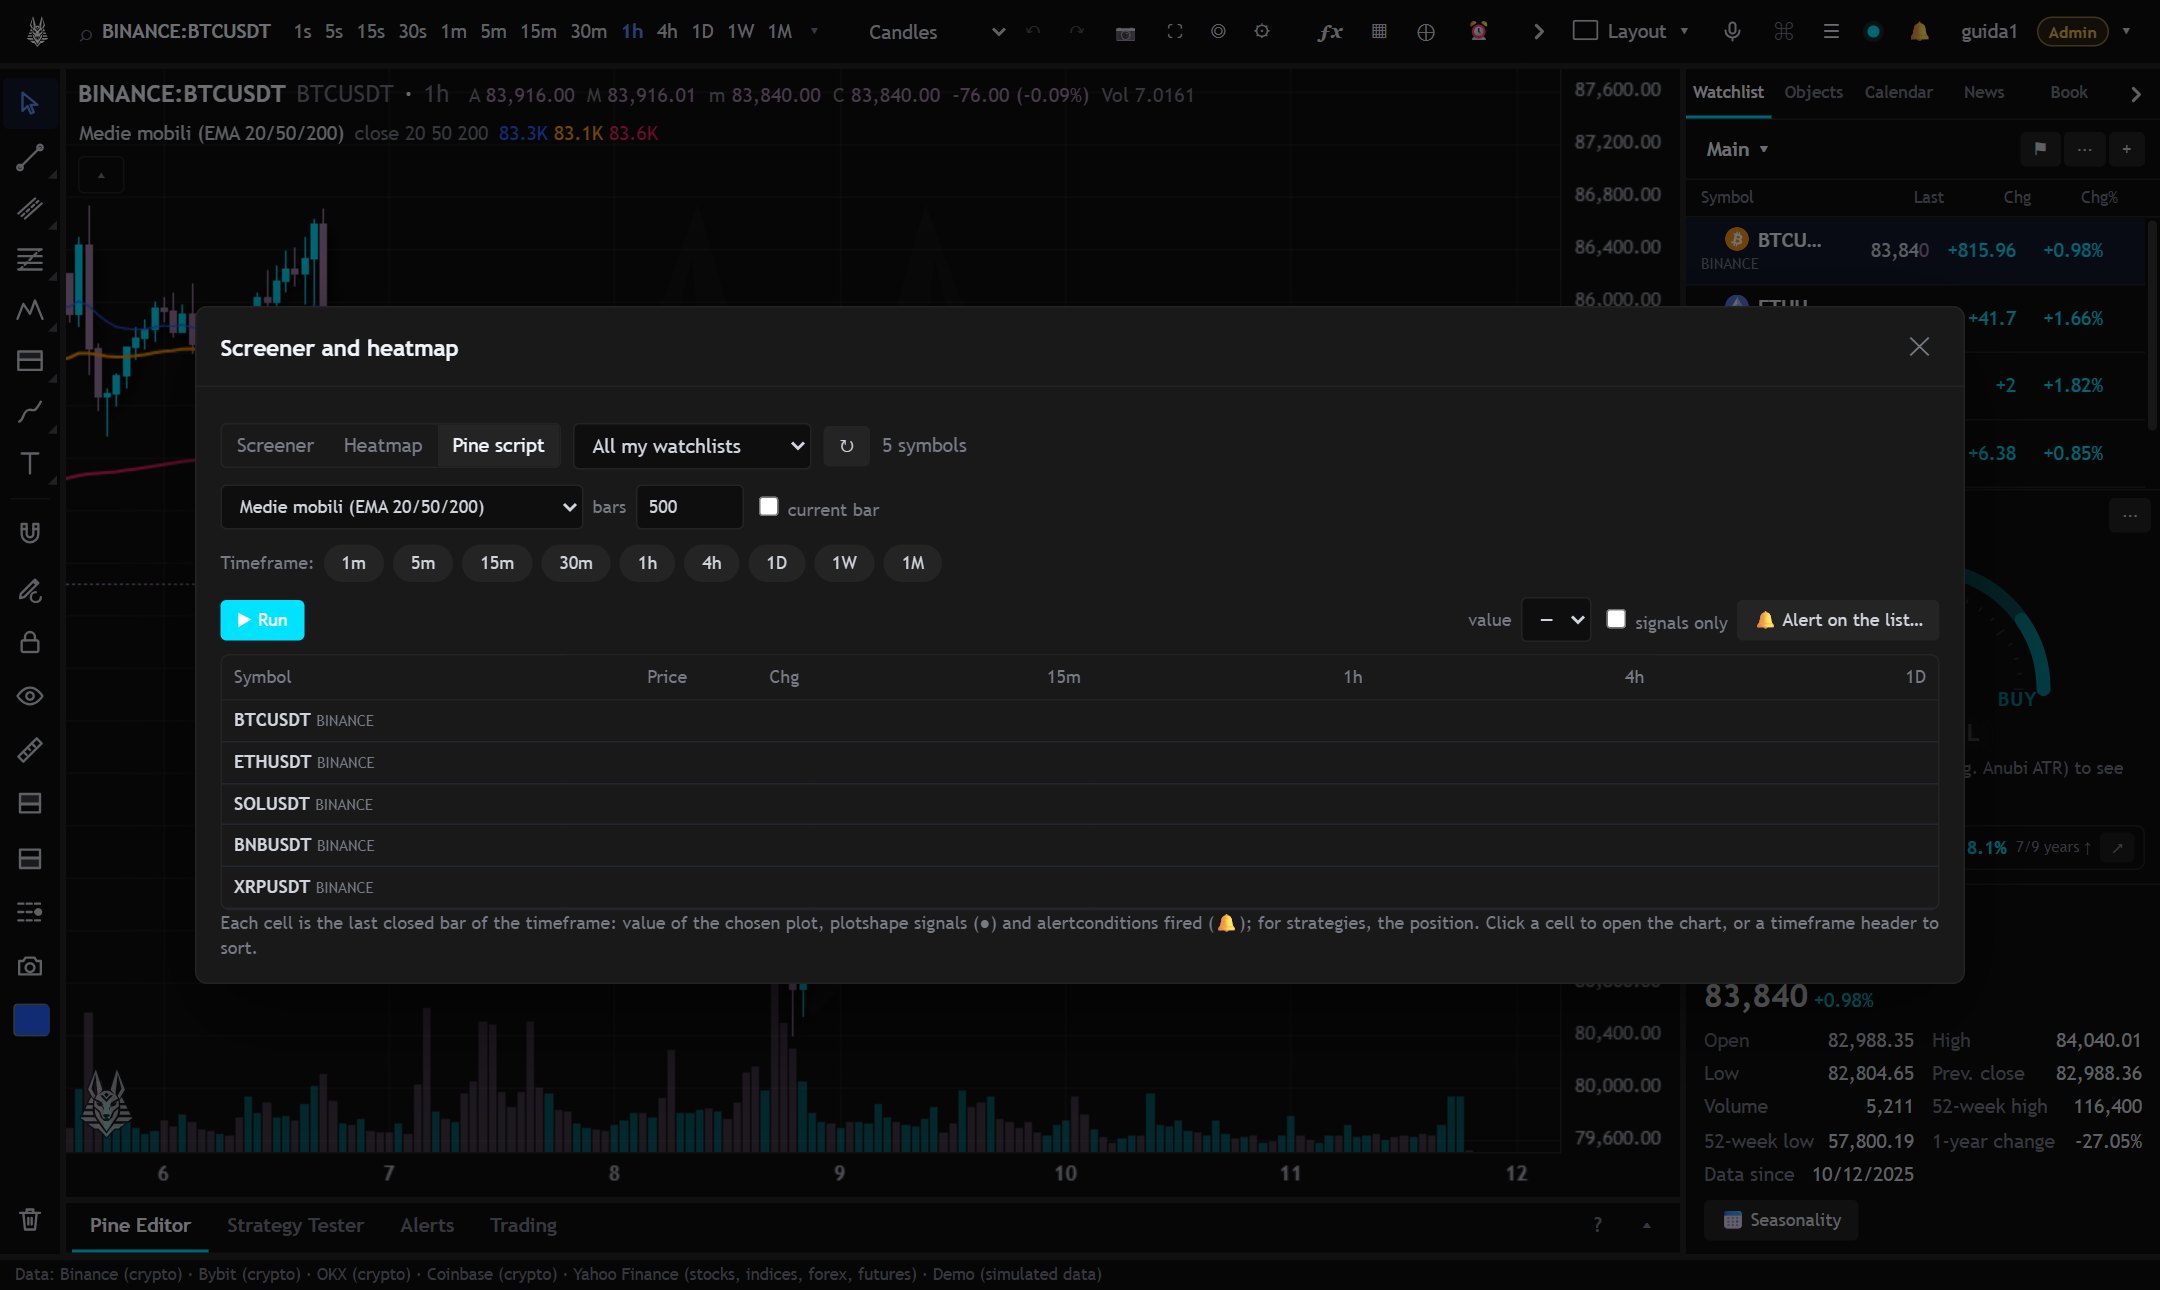
- Pine script: runs a script on several symbols and timeframes and summarizes the last bar (plot values and active conditions). From the results you create an alert on a watchlist with the same conditions.